Fig. 14
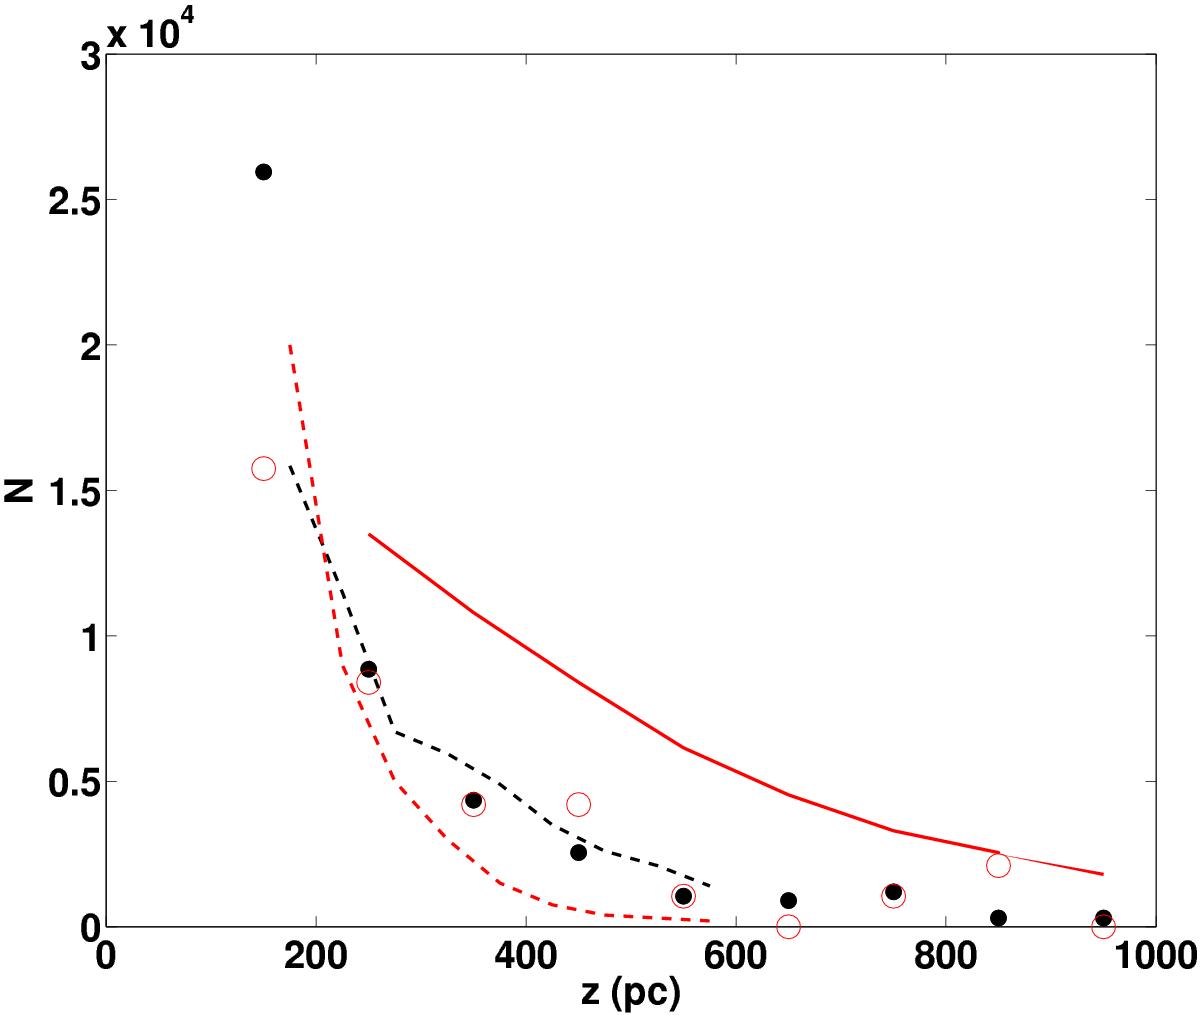
Predicted z-distribution of massive open clusters after 4.6 Gyr, as based on a BGS run with 1000 test particles subject to destruction due to GMC collisions (black dashed curve) and the corresponding distribution of stars (red dashed curve). The observed distribution from the WEBDA data base (Netopil et al. 2012) is indicated by black dots., and the distribution of old open clusters from Janes & Phelps (1994) within a Galactic cylinder with radius 3 kpc is marked with red circles. The bump around | z | ~ 850 pc in the latter data corresponds to altogether 2 individual clusters. The full red/grey curve denotes the observed stellar distribution, according to Yanny & Gardner (2013). We note that the scale of the N axis is ambigous, a relevant comparison is the ratio of the number of clusters around, say, z = 200, as compared with that at 500 pc.
Current usage metrics show cumulative count of Article Views (full-text article views including HTML views, PDF and ePub downloads, according to the available data) and Abstracts Views on Vision4Press platform.
Data correspond to usage on the plateform after 2015. The current usage metrics is available 48-96 hours after online publication and is updated daily on week days.
Initial download of the metrics may take a while.