Fig. 12
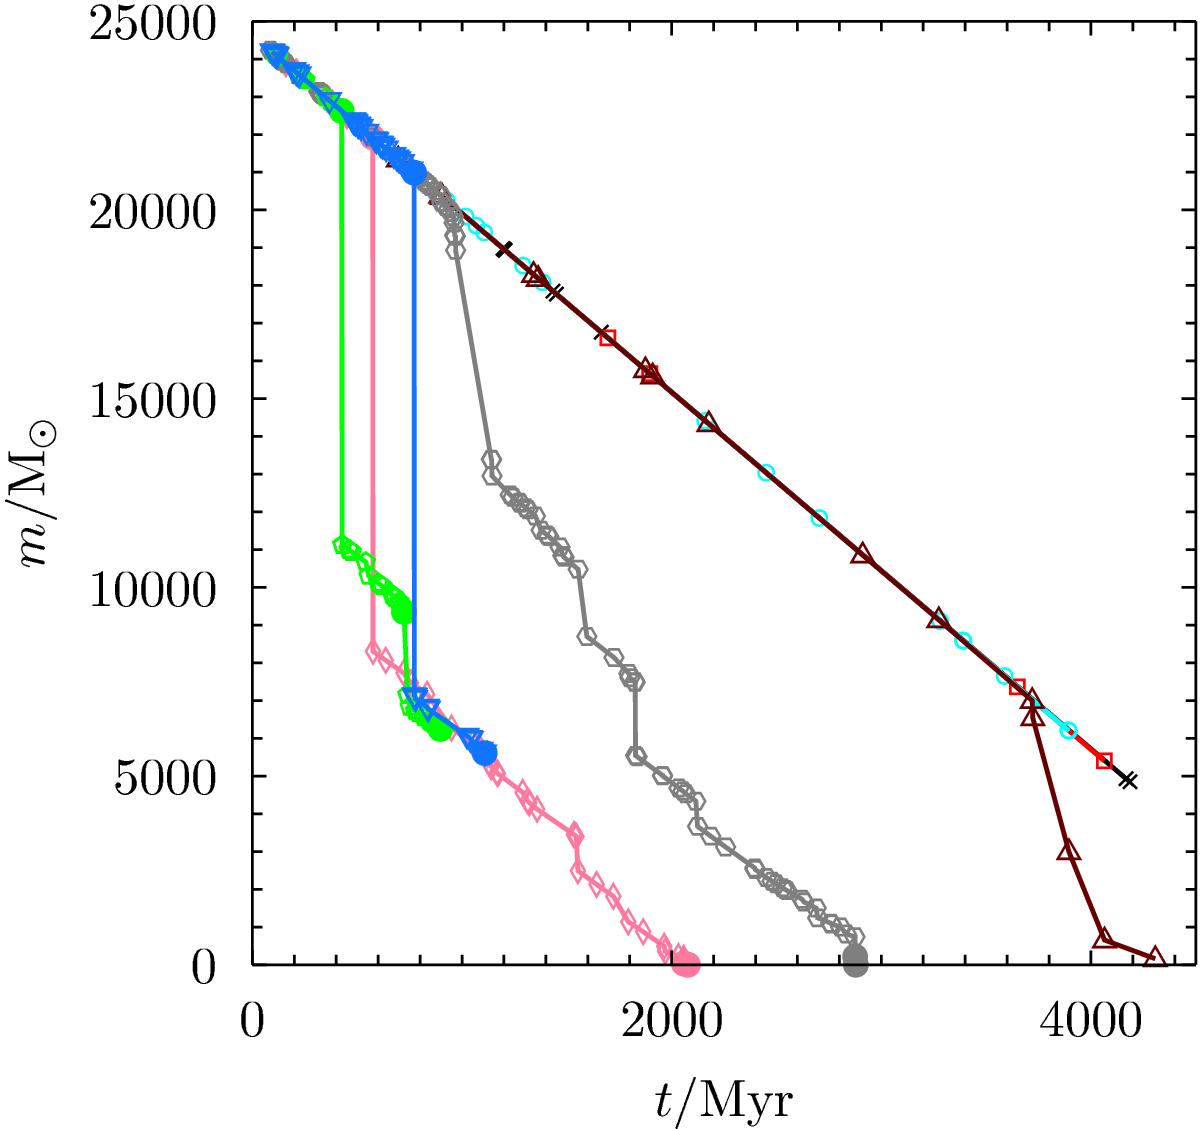
History of the stellar mass m in clusters in our synthetic cluster encounter simulations as a function of time t. The clusters shown are the eight in total whose ultimate heights above the Plane | zend | > 350 pc. Each line shows a separate cluster, indicated with a different point type and colour. Each point is an encounter between a cluster and a GMC. Colours and point types are the same as for the clusters in Fig. 11.
Current usage metrics show cumulative count of Article Views (full-text article views including HTML views, PDF and ePub downloads, according to the available data) and Abstracts Views on Vision4Press platform.
Data correspond to usage on the plateform after 2015. The current usage metrics is available 48-96 hours after online publication and is updated daily on week days.
Initial download of the metrics may take a while.