Fig. 1
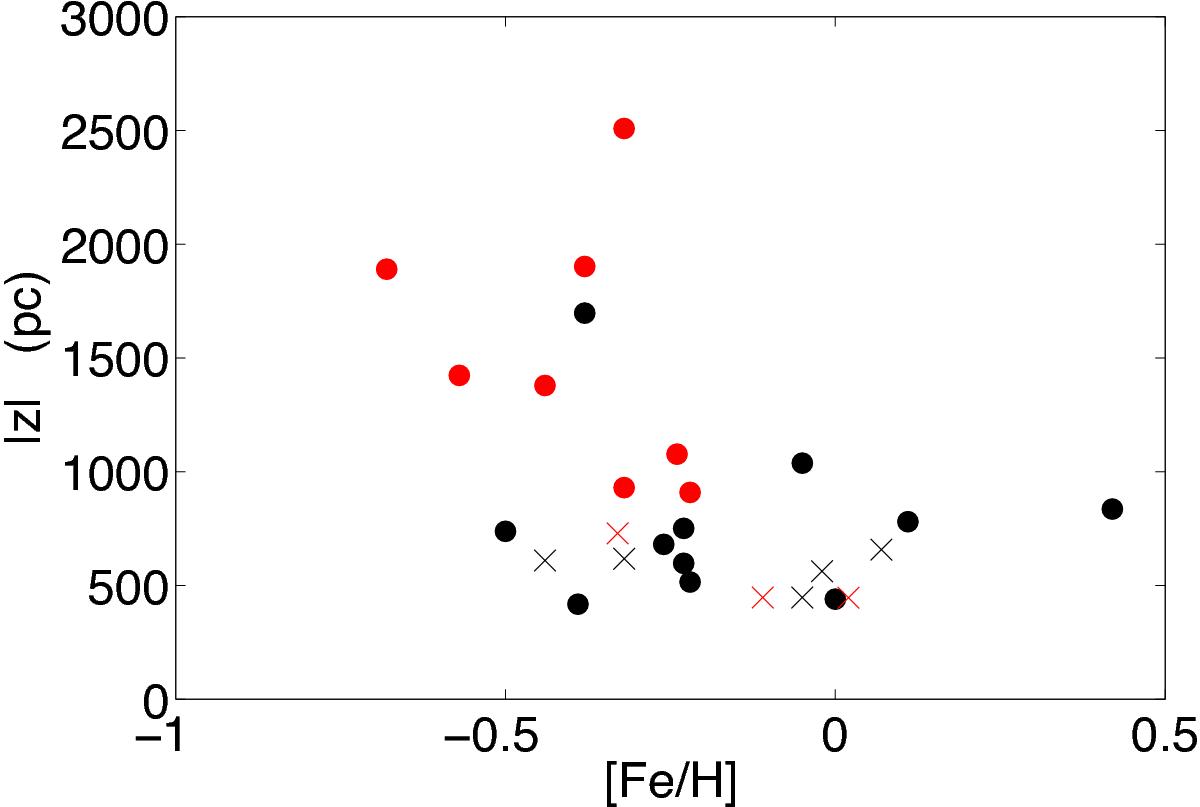
Distribution of high-altitude (| z | > 400 pc) clusters with positive and negative Galactic latitudes (black and red/grey, respectively). Dots indicate clusters older than 1.0 Gyr while crosses correspond to lower ages. Data were taken from Heiter et al. (2014), Paunzen & Netopil (2006), Netopil et al. (2012). The four old clusters at highest metallicity are marked by the four black dots to the right (in order left to right: NGC 2420, M 67, NGC 188 and NGC 6791.
Current usage metrics show cumulative count of Article Views (full-text article views including HTML views, PDF and ePub downloads, according to the available data) and Abstracts Views on Vision4Press platform.
Data correspond to usage on the plateform after 2015. The current usage metrics is available 48-96 hours after online publication and is updated daily on week days.
Initial download of the metrics may take a while.