| Issue |
A&A
Volume 592, August 2016
|
|
|---|---|---|
| Article Number | L13 | |
| Number of page(s) | 4 | |
| Section | Letters | |
| DOI | https://doi.org/10.1051/0004-6361/201629168 | |
| Published online | 12 August 2016 | |
Detection of 183 GHz H2O megamaser emission towards NGC 4945
1 European Southern Observatory (ESO), Karl-Schwarzschild-Str. 2, 85748 Garching bei München, Germany
e-mail: ehumphre@eso.org
2 Department of Earth and Space Sciences, Chalmers University of Technology, Onsala Space Observatory, 439 92 Onsala, Sweden
3 Joint Alma Office, Alsonso de Cordova 3107, 763 0355 Vitacura, Santiago, Chile
4 National Radio Astronomy Observatory, 520 Edgemont Road, Charlottesville, VA 22903, USA
Received: 22 June 2016
Accepted: 19 July 2016
Aims. The aim of this work is to search Seyfert 2 galaxy NGC 4945, a well-known 22 GHz water megamaser galaxy, for H2O (mega)maser emission at 183 GHz.
Methods. We used APEX SEPIA Band 5 (an ALMA Band 5 receiver on the APEX telescope) to perform the observations.
Results. We detected 183 GHz H2O maser emission towards NGC 4945 with a peak flux density of ~3 Jy near the galactic systemic velocity. The emission spans a velocity range of several hundred km s-1. We estimate an isotropic luminosity of >1000 L⊙, classifying the emission as a megamaser. A comparison of the 183 GHz spectrum with that observed at 22 GHz suggests that 183 GHz emission also arises from the active galactic nucleus (AGN) central engine. If the 183 GHz emission originates from the circumnuclear disk, then we estimate that a redshifted feature at 1084 km s-1 in the spectrum should arise from a distance of 0.022 pc from the supermassive black hole (1.6 × 10⁵ Schwarzschild radii), i.e. closer than the water maser emission previously detected at 22 GHz. This is only the second time 183 GHz maser emission has been detected towards an AGN central engine (the other galaxy being NGC 3079). It is also the strongest extragalactic millimetre/submillimetre water maser detected to date.
Conclusions. Strong millimetre 183 GHz H2O maser emission has now been shown to occur in an external galaxy. For NGC 4945, we believe that the maser emission arises, or is dominated by, emission from the AGN central engine. Emission at higher velocity, i.e. for a Keplerian disk closer to the black hole, has been detected at 183 GHz compared with that for the 22 GHz megamaser. This indicates that millimetre/submillimetre H2O masers can indeed be useful for tracing out more of AGN central engine structures and dynamics than previously probed. Future observations using ALMA Band 5 should unequivocally determine the origin of the emission in this and other galaxies.
Key words: galaxies: Seyfert / masers / submillimeter: general
© ESO, 2016
1. Introduction
Water megamaser galaxies have become the object of extensive study at 22 GHz, since the discovery that the emission traces a sub-parsec scale portion of the circumnuclear disk in NGC 4258, within 1 pc of the supermassive black hole (SMBH; Miyoshi et al. 1995). Very Long Baseline Interferometry (VLBI) observations of the masers have provided detailed information on the kinematics and structure of active galactic nucleus (AGN) circumnuclear disks (e.g. Moran et al. 1995; Greenhill et al. 1997; Trotter et al. 1998; Kondratko et al. 2005; Argon et al. 2007; Humphreys et al. 2008; Braatz et al. 2010; Impellizzeri et al. 2012; Reid et al. 2013; Kuo et al. 2015; Gao et al. 2016). Geometric modelling of VLBI disk maser data, provided that acceleration or proper motion measurements are also possible, can be used to perform maser cosmology and has yielded high-accuracy Hubble constant estimates (e.g. Humphreys et al. 2013; Braatz et al. 2015). Additionally, water megamasers can originate from the interaction of AGN radio jets with the interstellar medium, yielding masers in shocked gas within radii of 1–10 pc of the central regions (e.g. Claussen et al. 1998).
Radiative transfer models for galactic water masers have long predicted, and observations have found that, the 22 GHz maser does not occur in isolation; very similar conditions to those required to produce this maser yields additional H2O maser lines in the millimetre/submillimetre (mm/submm; e.g. Deguchi 1977; Neufeld & Melnick 1991; Yates et al. 1997; Humphreys et al. 2001; Gray et al. 2016). It is therefore believed that some mm/submm H2O masers could occur from broadly the same regions as 22 GHz masers in AGN and/or could probe unchartered regions of an AGN central engine, including regions closer to a black hole. Detection and study of mm/submm water masers could therefore make unique contributions to the study of disk and radio jet structure in AGN.
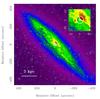 |
Fig. 1 Image of NGC 4945 from the Palomar Sky Survey1. The cross indicates the position for NGC 4945 used in our APEX SEPIA Band 5 observations: α2000 = 13:05:27.28, δ2000 = −49:28:04.4. The circle indicates the half-power beamwidth (HPBW) of the APEX observations. At a sky frequency of 182.981 GHz this corresponds to 31.8′′, or 570 pc at a distance of 3.7 Mpc. |
To date extragalactic mm/submm water maser emission has been detected for the 183 GHz transition towards NGC 3079 using the SMA (Humphreys et al. 2005), Arp 220 using the IRAM 30 m and APEX (Cernicharo et al. 2006; Galametz et al. 2016), and for the 321 GHz transition towards Circinus and NGC 4945 using ALMA (Hagiwara et al. 2013, 2016; Pesce et al. 2016). There has also been a tentative, 5σ detection of 439 GHz H2O water maser emission towards NGC 3079 using the James Clark Maxwell Telescope (Humphreys et al. 2005).
NGC 3079, Circinus, and NGC 4945 display 22 GHz megamaser emission, and the mm/submm water maser emission towards these targets has been interpreted as also arising from the AGN central engine. However, there is no 22 GHz detection towards Arp 220 and in this case the 183 GHz water megamaser emission is interpreted as arising from ~106 star-forming cores (Cernicharo et al. 2006) i.e. an environment similar to that giving rise to OH megamaser emission.
In this Letter, we report the first detection of 183 GHz H2O megamaser emission towards southern Seyfert 2 galaxy NGC 4945. The velocities quoted throughout this work are radio definition, local standard of rest. The distance used is 3.7 Mpc (Tully et al. 2013) and the systemic velocity adopted is 556 km s-1, based on CO observations (Dahlem et al. 1993).
2. Observations
The data were taken as part of programme 096.F-9312(A) using the APEX SEPIA2 Band 5 receiver (Billade et al. 2012). The observations were performed on 3 March 2015 at 03:40 UTC with a native channel width of 0.125 km s-1. The water line, of rest frequency 183.310 GHz from the para-H2O 313–220 transition, was tuned to the USB, which covered a frequency range of 181.306 to 185.313 GHz, while the LSB covered 169.285 to 173.292 GHz. The observations were made in wobbler mode with an off position 140′′ away in azimuth and a frequency of 0.5 Hz. Figure 1 indicates the position and the HPBW of the observations.
The total time on science target was 175 min, however the first portion of the data was discarded because of high PWV (>0.6 mm) leaving 88 min on target. In the remaining data, the water line could be seen in individual scans (5303 to 5309). Two later scans were discarded owing to an apparent loss of phase lock during this time. The total time remaining on science target was 58 min.
Baseline subtraction of polynomial order 2 was performed in the GILDAS CLASS package3 and the scans were averaged in time. We used a Jy/K factor of 34 to convert between antenna temperature  and flux density4 with an estimated uncertainty in the flux scale of 50%.
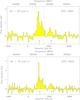 |
Fig. 2 183 GHz H2O emission towards NGC 4945: (top) data were binned to 40 km s-1 resolution; (bottom) data were binned to 25 km s-1 resolution. The red arrow indicates the approximate galactic systemic velocity of 556 km s-1. The dashed lines indicate the velocity range of 22 GHz H2O megamaser emission determined by Greenhill et al. (1997), about 410 to 800 km s-1. The velocities are radio heliocentric in Greenhill et al. (1997) and so we use vLSR = vhel−4.6 km s-1 to convert velocities. The black arrow denotes the velocity of a marginally significant feature in the 321 GHz spectrum reported by Hagiwara et al. (2016) (the strongest features at 321 GHz occurred between about 650 to 750 km s-1). The velocity scale is radio LSR. |
3. Results
The detection of 183 GHz water emission, obtained using APEX SEPIA Band 5, is shown in Fig. 2 for two different smoothings. The 1σ rms of the observations is 0.2 Jy and the peak is ~1.8 Jy for the spectrum binned to a velocity resolution of 40 km s-1. The emission is dominated by three main peaks at 505, 680, and 1084 km s-1. This spectrum was binned to emphasise the weaker redshifted feature at 1084 km s-1. The 1σ rms of the observations is 0.24 Jy and the peak is ~3 Jy for the spectrum binned to a velocity resolution of 25 km s-1. This binning is shown to indicate that the emission peak is stronger when less smoothing is applied, which is typical for maser spectra in which individual strong spikes could have FWHM as narrow as ~1 km s-1.
4. Discussion
4.1. Nature of the detected emission
Isotropic luminosity is not likely to be a meaningful physical quantity when it comes to maser emission, which can be highly beamed; however traditionally this has been used for megamaser classification purposes. The isotropic luminosity of the 183 GHz line is given by ![\begin{equation} \frac{L}{\left[L_{\odot} \right]} = 1.04 \times 10^{-3} \frac{\nu_{\rm rest}}{\rm \left[GHz \right]} \frac{D^2}{\rm \left[Mpc^2 \right]} \frac{\int S {\rm d}v}{\rm \left[Jy~km\,s^{-1} \right] }, \end{equation}](/articles/aa/full_html/2016/08/aa29168-16/aa29168-16-eq20.png) (1)where νrest = 183.310 GHz. Performing a single Gaussian fit to the blended maser emission between 400 and 800 km s-1 gives an estimate of the integrated line area of 11.606 K km s-1 or 394.6 Jy km s-1. Using a distance to NGC 4945 of 3.7 Mpc, then this gives an isotropic luminosity of 1029 L⊙. If emission from the redshifted feature at 1084 km s-1 is added in, then this becomes 1303 ± 652 L⊙ where the uncertainty quoted is wholly based on the uncertainty in the fluxscale.
(1)where νrest = 183.310 GHz. Performing a single Gaussian fit to the blended maser emission between 400 and 800 km s-1 gives an estimate of the integrated line area of 11.606 K km s-1 or 394.6 Jy km s-1. Using a distance to NGC 4945 of 3.7 Mpc, then this gives an isotropic luminosity of 1029 L⊙. If emission from the redshifted feature at 1084 km s-1 is added in, then this becomes 1303 ± 652 L⊙ where the uncertainty quoted is wholly based on the uncertainty in the fluxscale.
A water megamaser should have an isotropic luminosity of a million times greater than a typical Galactic star formation water maser, and at 22 GHz this is 10-4L⊙ (Lo 2005) (and likely less at 183 GHz), in which case the 183 GHz emission observed towards NGC 4945 certainly falls into the megamaser category. Indeed, famous 22 GHz megamasers towards NGC 4258 and NGC 1068 have isotropic luminosities of 120 and 450 L⊙ respectively (Lo 2005). The isotropic luminosity for the 183 GHz transition found here is much higher than that found for 321 GHz emission towards NCC 4945 at ~10 L⊙ (Pesce et al. 2016; Hagiwara et al. 2016). We speculate that this is due to the very different energy requirements of the two lines. Whereas the upper level of the 183 GHz transition lies at an Eu/k = 205 K above ground state and the 321 GHz line originates from a transition at Eu/k = 1862 K. The difference between the isotropic luminosities may indicate that the physical conditions needed to pump the 183 GHz water maser are more prevalent in the NGC 4945 central region than the conditions required to produce strong 321 GHz water maser emission. For comparison, the 22 GHz line arises from a transition of Eu/k = 644 K.
4.2. Does the emission originate from the AGN central engine?
There are now three extragalactic targets reported in the literature with detections of 183 GHz water maser emission: NGC 3079, which is attributed to arising from an AGN central engine as for the 22 GHz emission (Humphreys et al. 2005); Arp 220, which is attributed to a starburst origin (Cernicharo et al. 2006; Galametz et al. 2016); and this new detection for NGC 4945. What is the likely physical origin of the newly detected maser emission in NGC 4945?
Greenhill et al. (1997, G97) mapped the 22 GHz H2O emission towards NGC 4945 from 409 km s-1 to 714 km s-1 using a subset of the VLBA, although weak/marginal emission was detected up to about 800 km s-1. It was found to originate from a linear structure extending about 40 mas (~0.7 pc at a distance of 3.7 Mpc), which is interpreted as a portion of the AGN circumnuclear disk. G97 used the observations to estimate a black hole mass of MBH = 1.4 × 10⁶M⊙. Since 183 GHz and 22 GHz emission can be produced by similar sets of physical conditions, and since the velocity range of the 183 GHz emission extends across the range detected at 22 GHz by G97, we believe that it is likely that the two maser lines originate from similar locations in NGC 4945, either entirely or predominantly from the AGN central engine. This can be verified by future high spatial resolution observations, which only ALMA can provide.
If the 183 GHz emission does originate from the circumnuclear disk, we can estimate the radius of emission of the highest velocity feature at 1084 km s-1, i.e. that closest to the black hole. For an edge-on disk and for emission arising from the disk midline (the line perpendicular to the line of sight to the black hole) the linear radius of the feature from the black hole is given by rfeature = GMBH/ Δv2 = 0.022 pc or 1.6 × 10⁵ Schwarzschild radii. Hagiwara et al. (2016) detected marginally significant high-velocity emission at 321 GHz towards NGC 4945 at voptical,LSR = 1138.6 km s-1. In the literature, 22 GHz maser spectra do not display velocities much above 1000 km s-1 (e.g. G97; Pesce et al. 2016; Hagiwara et al. 2016).
4.3. Physical conditions leading to the emission
Multiple maser radiative transfer models provide conditions leading to 183 GHz H2O maser emission that are appropriate to evolved stars and star-forming regions. The 22 GHz maser emission associated with the AGN central engine disk is believed to be pumped by X-rays from the central engine obliquely irradiating portions of the warped disk, thereby causing heating (Neufeld et al. 1994). Assuming that this yields similar gas/dust conditions to galactic water masers, the presence of 183 GHz and 22 GHz emission likely indicates conditions found by Gray et al. (2016). For the 22 GHz transition, strongest emission occurs between Tk = 500 to 2500 K and n(H2) = 109−11 cm-3. The strongest emission occurs between Tk = 500 to 2000 K and n(H2) = 108−10 cm-3 for the 183 GHz transition. We note the overlapping parameter space for strong emission at both frequencies, and also that Gray et al. (2016) did not investigate densities below 107 cm-3.
For Arp 220, in which 183 GHz H2O emission is observed in the absence of 22 GHz, Cernicharo et al. (2006) find that significantly lower gas densities must be giving rise to the emission (or else 22 GHz emission would also be detectable) i.e. n(H2) < 106 cm-3 or Tk< 40 K. These are conditions found in Galactic high-mass star formation, such that the Arp 220 183 GHz emission is proposed to be associated with the Arp 220 starburst rather than the AGN nuclei. Lack of variability of the Arp 220 183 GHz emission when observed with single dishes supports this hypothesis, since the variability of the maser emission for individual star-forming cores could be washed out by beam averaging (Galametz et al. 2016).
The 183 GHz maser emission detected towards NGC 3079 has a significantly lower isotropic luminosity and narrower velocity range of emission than the emission detected towards NGC 4945, even though both are attributed to arising from the AGN. There may be many reasons for the difference. However, in the case of NGC 3079, it appears that the strongest 22 GHz emission occurs for a velocity range where 183 GHz emission is weak or absent. From the results of Gray et al. (2016), this may indicate that a significant proportion of the gas in the NGC 3079 central engine is too dense for strong 183 GHz emission to arise, while it can still produce strong 22 GHz emission (Humphreys et al. 2005, Fig. 2) i.e. n(H2) > 1010 cm-3. In this scenario, the NGC 4945 AGN would have more molecular gas in the density range n(H2) = 108−10 cm-3 than NGC 3079.
5. Conclusions
We have made a first detection of 183 GHz H2O maser emission towards NGC 4945 using APEX SEPIA Band 5. The emission is strong, with a peak flux density of ~3 Jy near the galactic systemic velocity. The velocity range of the emission extends across several hundreds of km s-1, from about 400 to 1100 km s-1. The isotropic luminosity of the line classifies it as a megamaser.
Comparison of the 183 GHz spectrum with that observed at 22 GHz suggests that at least the bulk of the 183 GHz emission arises from a similar location in NGC 4945. From a VLBA map of the 22 GHz emission towards NGC 4945, we believe that 183 GHz emission is arising from the AGN central engine from the circumnuclear disk. Detection of high-velocity emission at 1084 km s-1 (528 km s-1 from the galactic systemic velocity), if also associated with the disk, is closer to the black hole than 22 GHz emission detected to date for this target. For Keplerian rotation, the emission would be at only 0.022 pc from the black hole (1.6 × 10⁵ Schwarzschild radii).
Further study of this megamaser should be made using ALMA Band 5. On 15 km baselines, an angular resolution of 23 milliarcseconds could be achieved. Indeed APEX now provides an ideal 183 GHz survey instrument for performing pathfinder observations of megamaser candidates, which can then form the groundwork for spatially resolved ALMA studies.
The Digitized Sky Surveys were produced at the Space Telescope Science Institute under US Government grant NAG W-2166. The images of these surveys are based on photographic data obtained using the Oschin Schmidt Telescope on Palomar Mountain and the UK Schmidt Telescope. The plates were processed into the present compressed digital form with the permission of these institutions.
Acknowledgments
We thank the staff of the APEX Observatory for performing these observations. We also thank staff from Onsala Space Observatory, Chalmers University, and from ESO for assistance with the data.
References
- Argon, A. L., Greenhill, L. J., Reid, M. J., Moran, J. M., & Humphreys, E. M. L. 2007, ApJ, 659, 1040 [NASA ADS] [CrossRef] [Google Scholar]
- Billade, B., Nyström, O., Meledin, D., et al. 2012, IEEE Trans. Terahertz Science and Technology, 2, 208 [NASA ADS] [CrossRef] [Google Scholar]
- Braatz, J. A., Reid, M. J., Humphreys, E. M. L., et al. 2010, ApJ, 718, 657 [NASA ADS] [CrossRef] [Google Scholar]
- Braatz, J., Condon, J., Constantin, A., et al. 2015, IAU General Assembly, 22, 2255730 [Google Scholar]
- Cernicharo, J., Pardo, J. R., & Weiss, A. 2006, ApJ, 646, L49 [NASA ADS] [CrossRef] [Google Scholar]
- Claussen, M. J., Diamond, P. J., Braatz, J. A., Wilson, A. S., & Henkel, C. 1998, ApJ, 500, L129 [NASA ADS] [CrossRef] [Google Scholar]
- Dahlem, M., Golla, G., Whiteoak, J. B., et al. 1993, A&A, 270, 29 [NASA ADS] [Google Scholar]
- Deguchi, S. 1977, PASJ, 29, 669 [NASA ADS] [Google Scholar]
- Galametz, M., Zhang, Z.-Y., Immer, K., et al. 2016, MNRAS, 462, L36 [NASA ADS] [CrossRef] [Google Scholar]
- Gao, F., Braatz, J. A., Reid, M. J., et al. 2016, ApJ, 817, 128 [NASA ADS] [CrossRef] [Google Scholar]
- Gray, M. D., Baudry, A., Richards, A. M. S., et al. 2016, MNRAS, 456, 374 [NASA ADS] [CrossRef] [Google Scholar]
- Greenhill, L. J., Moran, J. M., & Herrnstein, J. R. 1997, ApJ, 481, L23 [NASA ADS] [CrossRef] [Google Scholar]
- Hagiwara, Y., Miyoshi, M., Doi, A., & Horiuchi, S. 2013, ApJ, 768, L38 [NASA ADS] [CrossRef] [Google Scholar]
- Hagiwara, Y., Horiuchi, S., Doi, A., Miyoshi, M., & Edwards, P. G. 2016, ApJ, submitted [arXiv:1604.07937] [Google Scholar]
- Humphreys, E. M. L., Yates, J. A., Gray, M. D., Field, D., & Bowen, G. H. 2001, A&A, 379, 501 [NASA ADS] [CrossRef] [EDP Sciences] [Google Scholar]
- Humphreys, E. M. L., Greenhill, L. J., Reid, M. J., et al. 2005, ApJ, 634, L133 [NASA ADS] [CrossRef] [Google Scholar]
- Humphreys, E. M. L., Reid, M. J., Greenhill, L. J., Moran, J. M., & Argon, A. L. 2008, ApJ, 672, 800 [NASA ADS] [CrossRef] [Google Scholar]
- Humphreys, E. M. L., Reid, M. J., Moran, J. M., Greenhill, L. J., & Argon, A. L. 2013, ApJ, 775, 13 [Google Scholar]
- Impellizzeri, C. M. V., Braatz, J. A., Kuo, C.-Y., et al. 2012, in Cosmic Masers – from OH to H0, eds. R. S. Booth, W. H. T. Vlemmings, & E. M. L. Humphreys, IAU Symp., 287, 311 [Google Scholar]
- Kondratko, P. T., Greenhill, L. J., & Moran, J. M. 2005, ApJ, 618, 618 [NASA ADS] [CrossRef] [Google Scholar]
- Kuo, C. Y., Braatz, J. A., Lo, K. Y., et al. 2015, ApJ, 800, 26 [NASA ADS] [CrossRef] [Google Scholar]
- Lo, K. Y. 2005, ARA&A, 43, 625 [NASA ADS] [CrossRef] [Google Scholar]
- Miyoshi, M., Moran, J., Herrnstein, J., et al. 1995, Nature, 373, 127 [NASA ADS] [CrossRef] [Google Scholar]
- Moran, J., Greenhill, L., Herrnstein, J., et al. 1995, PNAS, 92, 11427 [NASA ADS] [CrossRef] [Google Scholar]
- Neufeld, D. A., & Melnick, G. J. 1991, ApJ, 368, 215 [NASA ADS] [CrossRef] [Google Scholar]
- Neufeld, D. A., Maloney, P. R., & Conger, S. 1994, ApJ, 436, L127 [NASA ADS] [CrossRef] [Google Scholar]
- Pesce, D. W., Braatz, J. A., & Impellizzeri, C. M. V. 2016, ApJ, submitted [arXiv:1604.03789] [Google Scholar]
- Reid, M. J., Braatz, J. A., Condon, J. J., et al. 2013, ApJ, 767, 154 [NASA ADS] [CrossRef] [Google Scholar]
- Trotter, A. S., Greenhill, L. J., Moran, J. M., et al. 1998, ApJ, 495, 740 [NASA ADS] [CrossRef] [Google Scholar]
- Tully, R. B., Courtois, H. M., Dolphin, A. E., et al. 2013, AJ, 146, 86 [NASA ADS] [CrossRef] [Google Scholar]
- Yates, J. A., Field, D., & Gray, M. D. 1997, MNRAS, 285, 303 [NASA ADS] [Google Scholar]
All Figures
|
Fig. 1 Image of NGC 4945 from the Palomar Sky Survey1. The cross indicates the position for NGC 4945 used in our APEX SEPIA Band 5 observations: α2000 = 13:05:27.28, δ2000 = −49:28:04.4. The circle indicates the half-power beamwidth (HPBW) of the APEX observations. At a sky frequency of 182.981 GHz this corresponds to 31.8′′, or 570 pc at a distance of 3.7 Mpc. |
| In the text | |
|
Fig. 2 183 GHz H2O emission towards NGC 4945: (top) data were binned to 40 km s-1 resolution; (bottom) data were binned to 25 km s-1 resolution. The red arrow indicates the approximate galactic systemic velocity of 556 km s-1. The dashed lines indicate the velocity range of 22 GHz H2O megamaser emission determined by Greenhill et al. (1997), about 410 to 800 km s-1. The velocities are radio heliocentric in Greenhill et al. (1997) and so we use vLSR = vhel−4.6 km s-1 to convert velocities. The black arrow denotes the velocity of a marginally significant feature in the 321 GHz spectrum reported by Hagiwara et al. (2016) (the strongest features at 321 GHz occurred between about 650 to 750 km s-1). The velocity scale is radio LSR. |
| In the text | |
Current usage metrics show cumulative count of Article Views (full-text article views including HTML views, PDF and ePub downloads, according to the available data) and Abstracts Views on Vision4Press platform.
Data correspond to usage on the plateform after 2015. The current usage metrics is available 48-96 hours after online publication and is updated daily on week days.
Initial download of the metrics may take a while.