Fig. 5
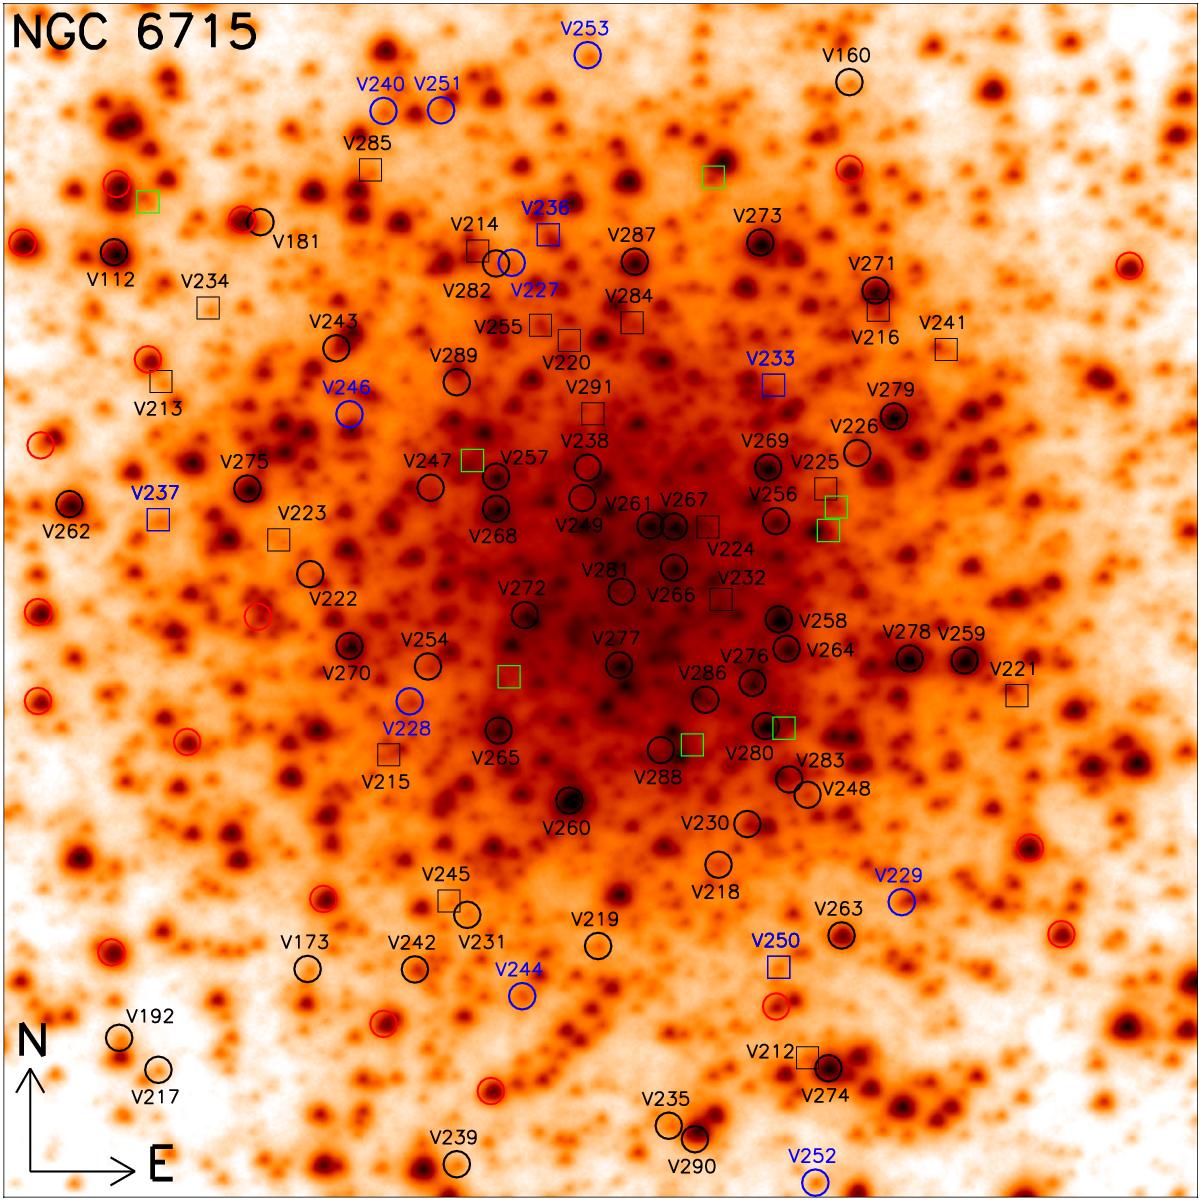
Finding chart for the globular cluster NGC 6715. The image used corresponds to the reference image constructed during the reduction. All known variables and new discoveries are labelled with their V numbers. Known variables, or new variables discovered in this work, are plotted with black symbols. Variables discovered by the OGLE survey are plotted with blue symbols. Those variables that were candidate variables from Montiel & Mighell (2010) are plotted using squares. Otherwise symbols are circles. Green squares and red circles, both without labels, are candidate variables from Montiel & Mighell (2010) and McDonald et al. (2014), respectively, for which we do not detect variability in our survey. Image size is ~40 × 40 arcsec2.
Current usage metrics show cumulative count of Article Views (full-text article views including HTML views, PDF and ePub downloads, according to the available data) and Abstracts Views on Vision4Press platform.
Data correspond to usage on the plateform after 2015. The current usage metrics is available 48-96 hours after online publication and is updated daily on week days.
Initial download of the metrics may take a while.