Free Access
Fig. 2
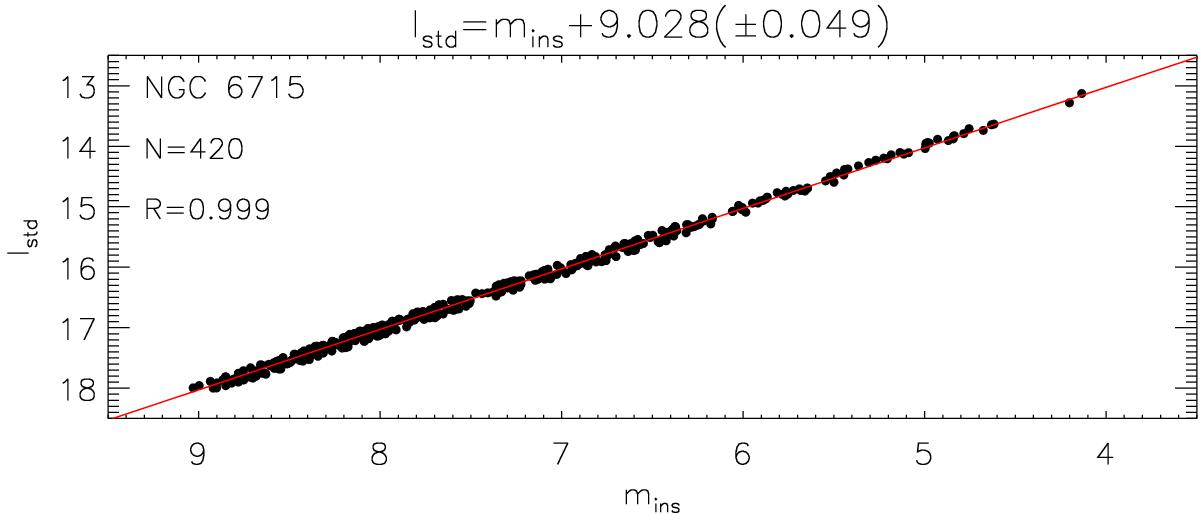
Standard I magnitude taken from the HST observations as a function of the instrumental i′ + z′ magnitude. The red line is the fit that best matches the data and it is described by the equation in the title. The correlation coefficient is 0.999.
Current usage metrics show cumulative count of Article Views (full-text article views including HTML views, PDF and ePub downloads, according to the available data) and Abstracts Views on Vision4Press platform.
Data correspond to usage on the plateform after 2015. The current usage metrics is available 48-96 hours after online publication and is updated daily on week days.
Initial download of the metrics may take a while.