Fig. 5
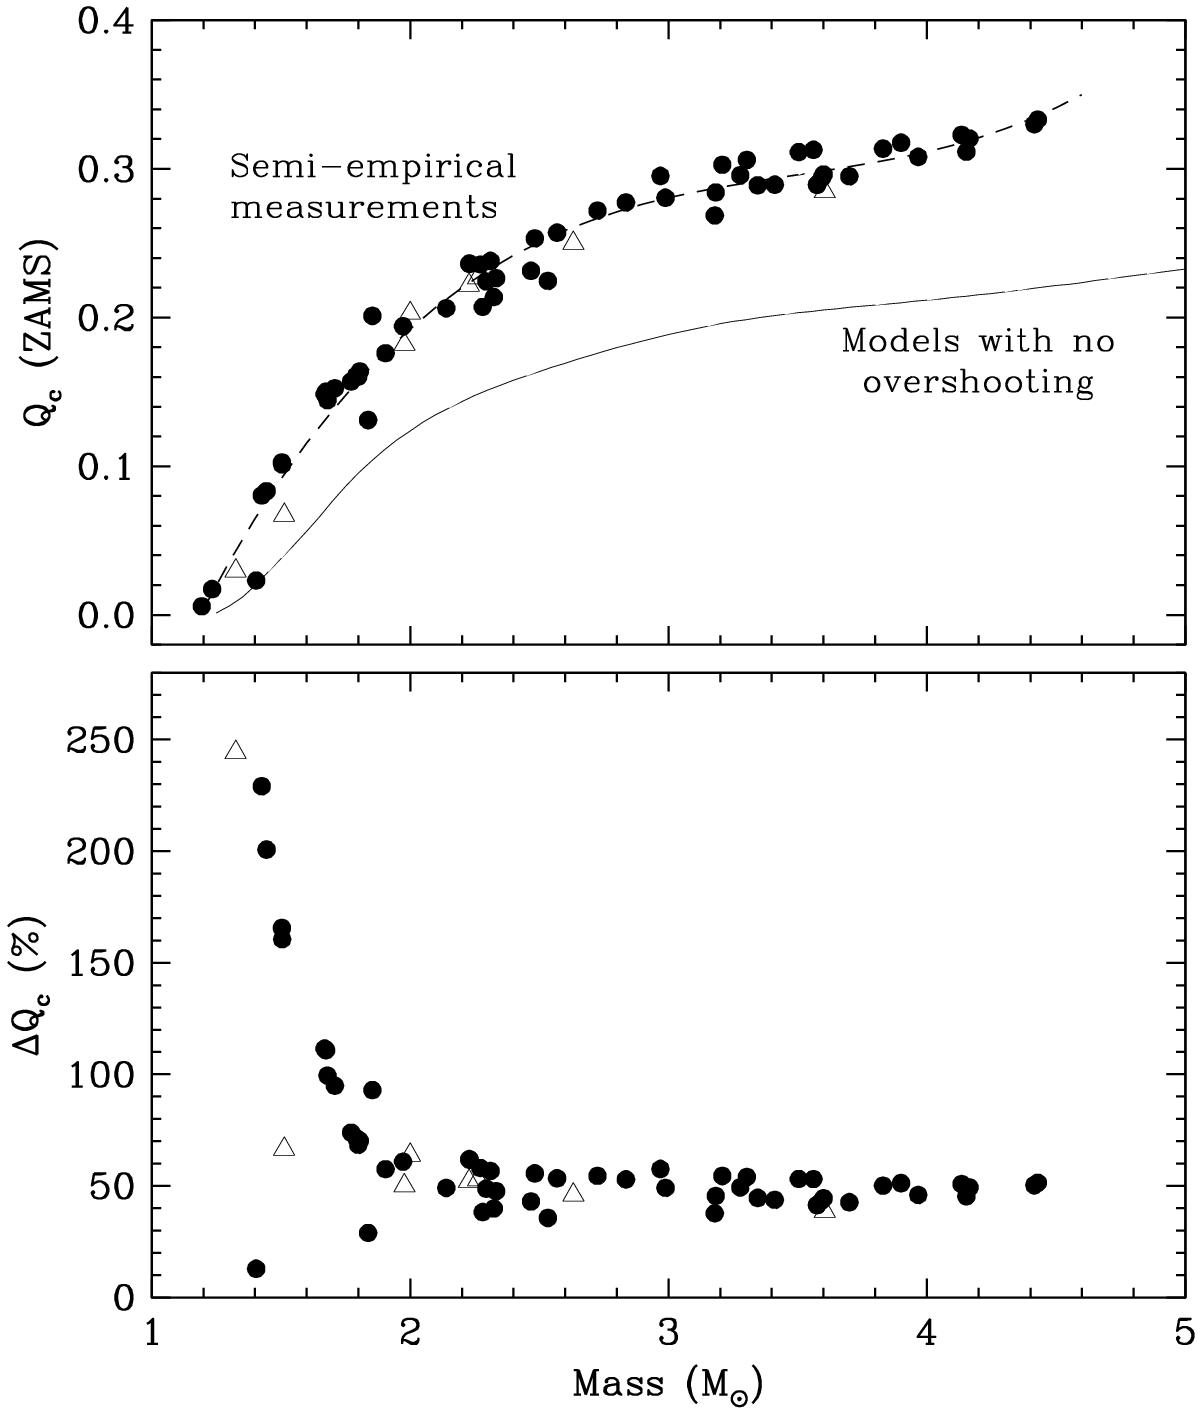
Top: semi-empirical values Qc of the convective core mass at the ZAMS (normalized to the total mass) for each of the stars in our sample. Triangles represent components of systems with age differences exceeding 5%. The dashed line is a third-order polynomial fit drawn to guide the eye. The solid line shows the trend of Qc with mass for solar-metallicity ZAMS models having αov = 0, for reference. Bottom: fractional increase in Qc over that indicated by the solid line in the top panel, expressed as a percentage.
Current usage metrics show cumulative count of Article Views (full-text article views including HTML views, PDF and ePub downloads, according to the available data) and Abstracts Views on Vision4Press platform.
Data correspond to usage on the plateform after 2015. The current usage metrics is available 48-96 hours after online publication and is updated daily on week days.
Initial download of the metrics may take a while.