Fig. 1
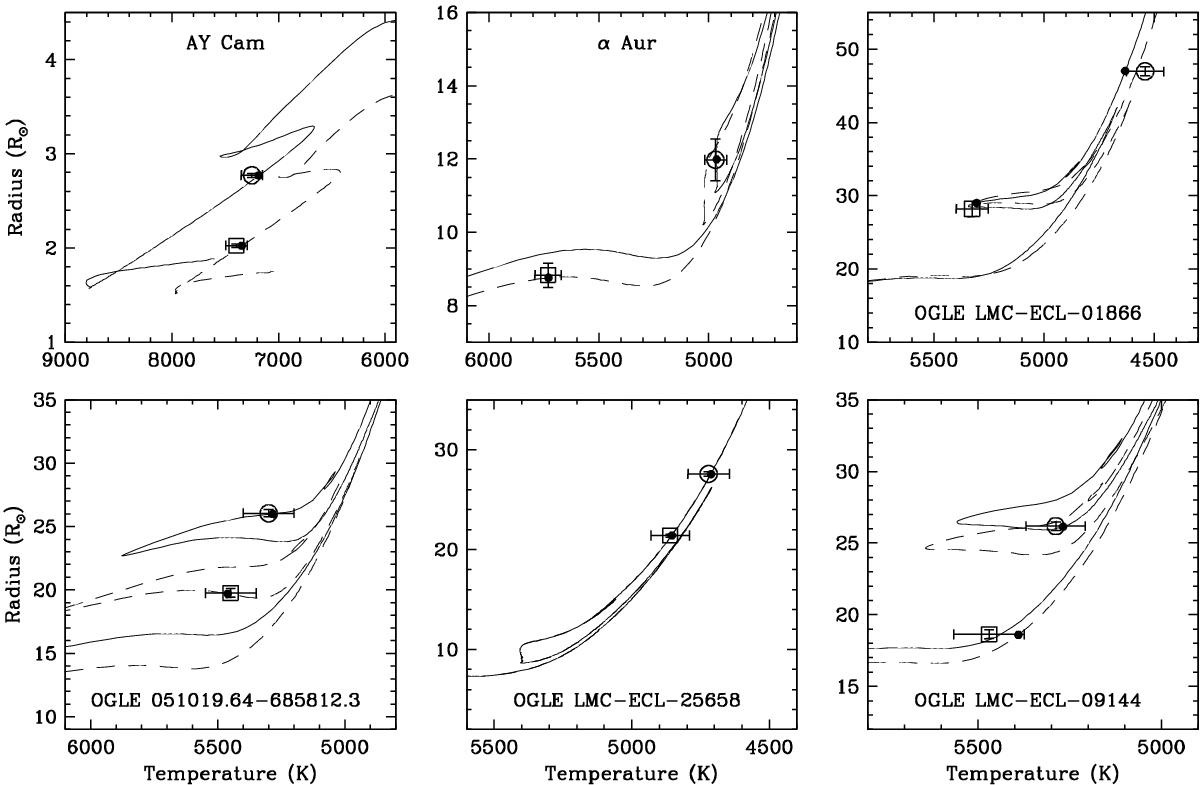
Sample best fits to six of our binaries in the R vs. Teff diagram. Evolutionary tracks and observations for the primary in each system are represented with solid lines and open circles, while dashed lines and open squares are used for the secondary. Small dots indicate the best-fit location on each track and are always within the measurement uncertainties.
Current usage metrics show cumulative count of Article Views (full-text article views including HTML views, PDF and ePub downloads, according to the available data) and Abstracts Views on Vision4Press platform.
Data correspond to usage on the plateform after 2015. The current usage metrics is available 48-96 hours after online publication and is updated daily on week days.
Initial download of the metrics may take a while.