Fig. 4
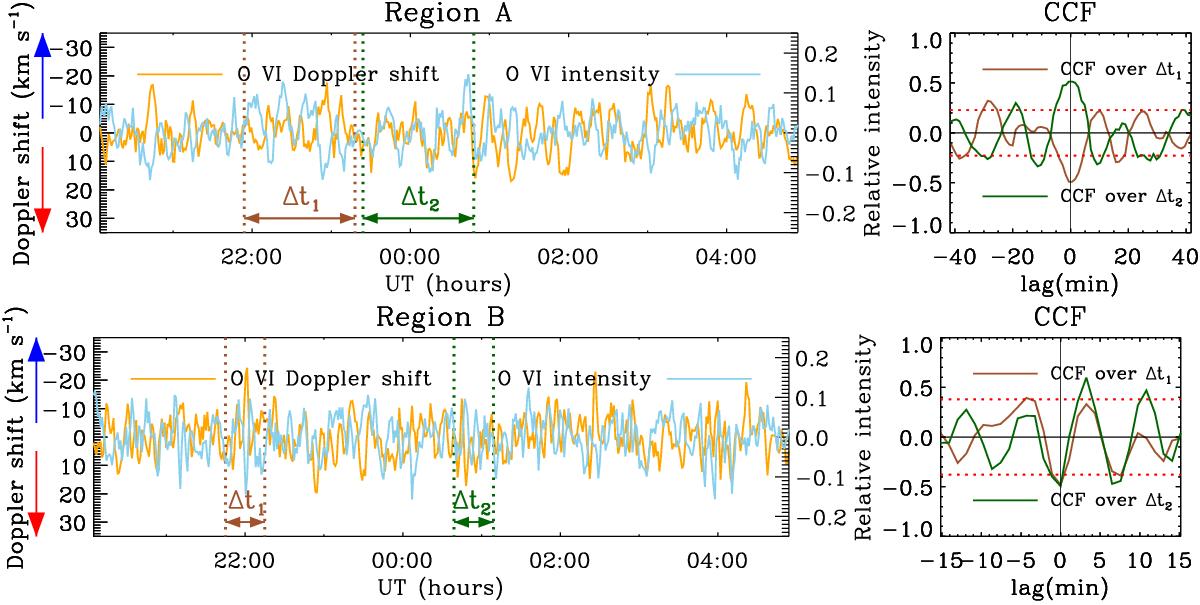
Left panels: O vi 1032 Å relative intensity and Doppler shift variations over region A (top) and B (bottom). The time series have been denoised, respectively, with a 5-point and 3-point moving average. Vertical lines delineate the time interval over which the CCF (right panels) was calculated, roughly corresponding to the maximum power in the respective wavelet spectra. The red dotted lines are the c.l.
Current usage metrics show cumulative count of Article Views (full-text article views including HTML views, PDF and ePub downloads, according to the available data) and Abstracts Views on Vision4Press platform.
Data correspond to usage on the plateform after 2015. The current usage metrics is available 48-96 hours after online publication and is updated daily on week days.
Initial download of the metrics may take a while.