Fig. 6
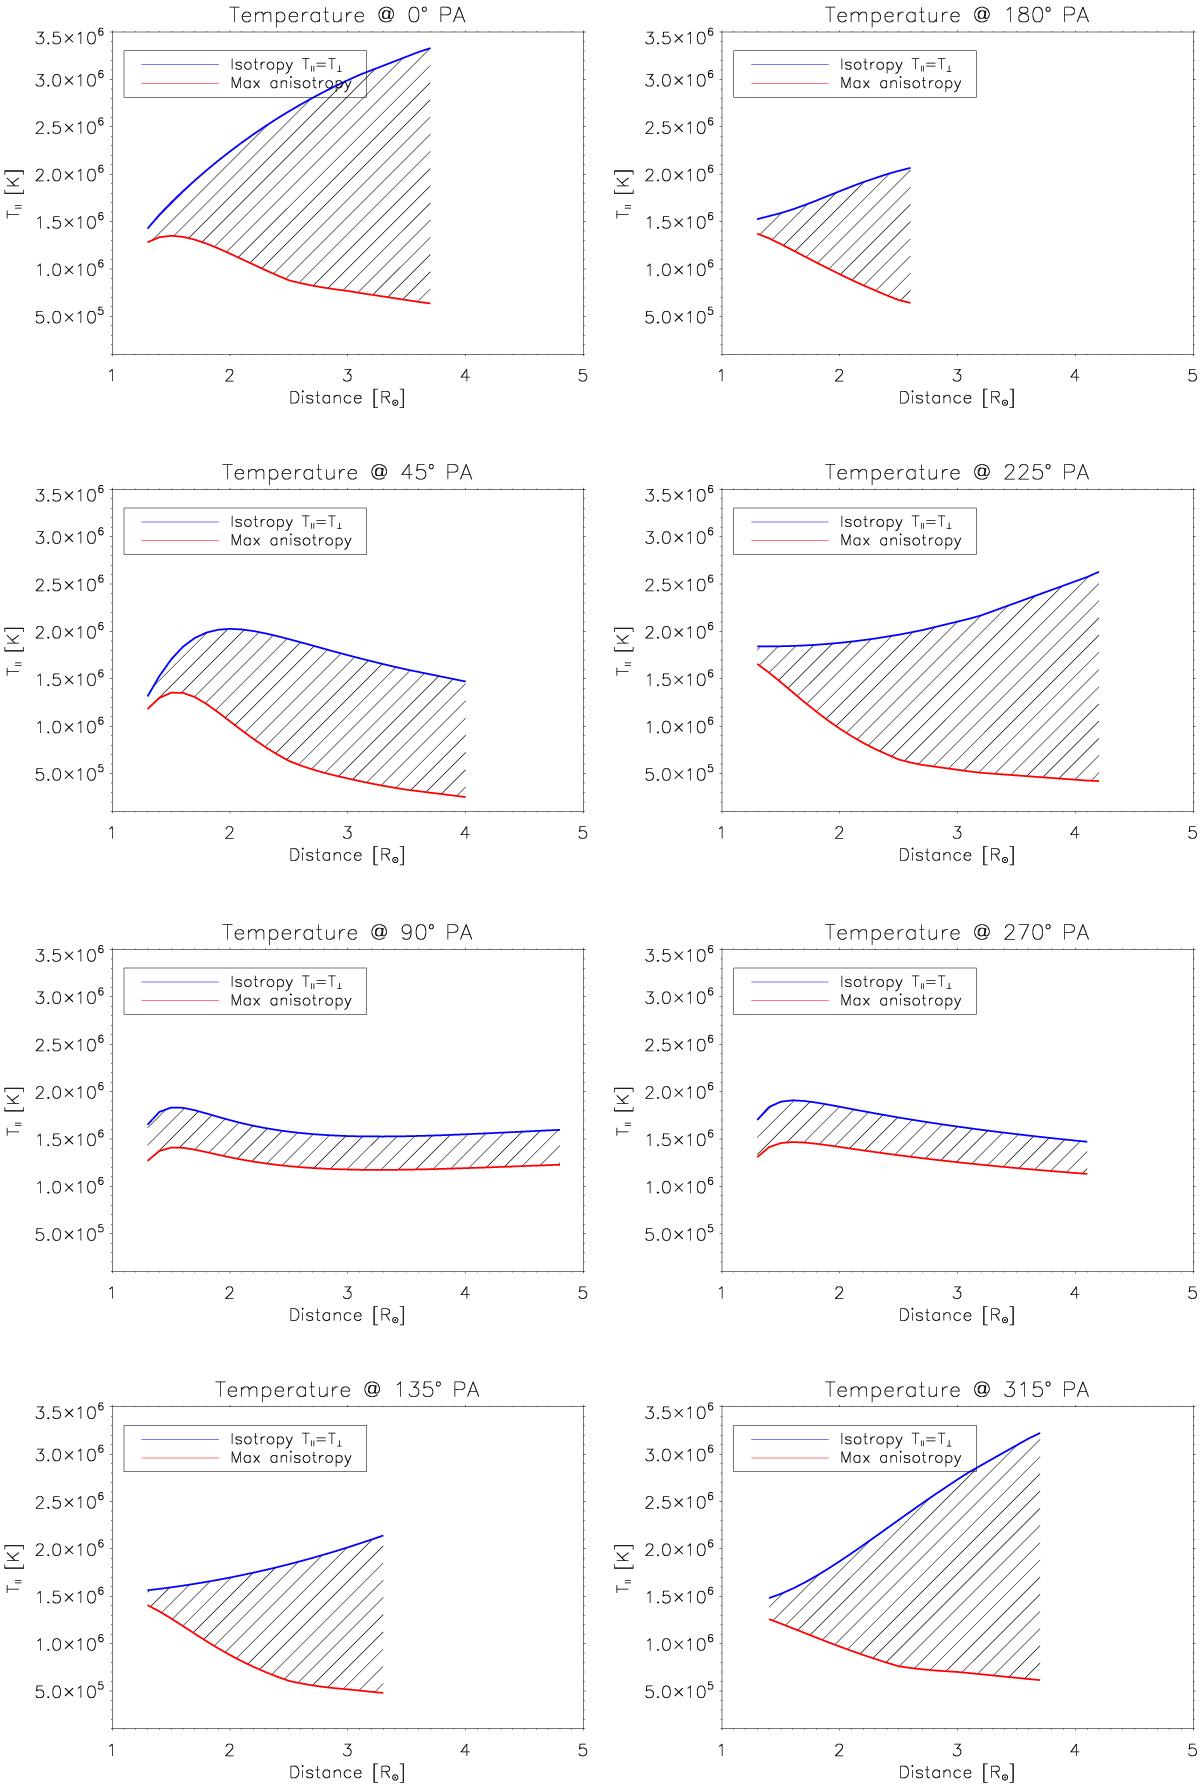
H i temperature parallel to the magnetic field lines as a function of the heliocentric distance derived from measurements of T⊥ during the minimum phase of the solar activity cycle. Plots show the results at the different angular sectors separated by 45 degrees counterclockwise from the solar north pole (0° PA). The range of feasible T∥ values (shaded area) is delimited by the conditions of maximum anisotropy (red line) and isotropy (blue line).
Current usage metrics show cumulative count of Article Views (full-text article views including HTML views, PDF and ePub downloads, according to the available data) and Abstracts Views on Vision4Press platform.
Data correspond to usage on the plateform after 2015. The current usage metrics is available 48-96 hours after online publication and is updated daily on week days.
Initial download of the metrics may take a while.