Fig. 8
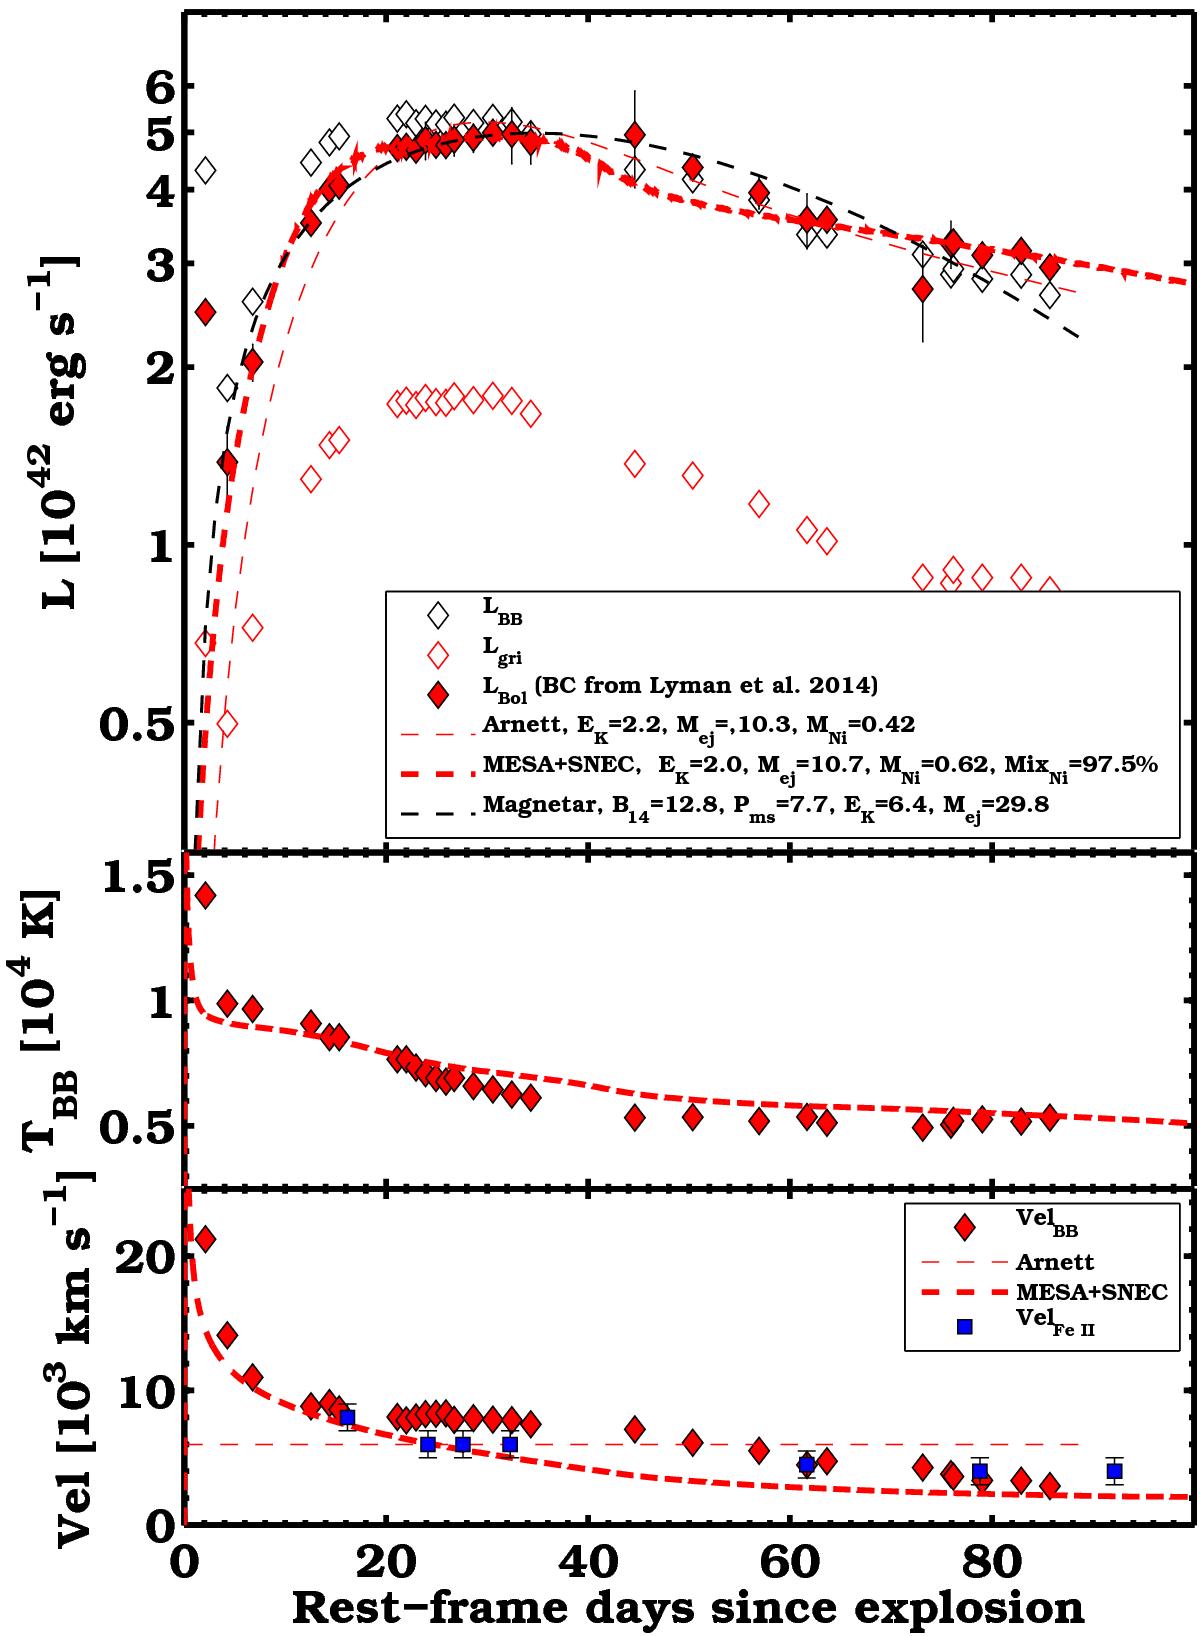
Top panel: bolometric light curves of iPTF15dtg. The empty black diamonds represent the bolometric light curve obtained from the BB fit to the SEDs. The empty red diamonds represent the gri integrated luminosity. The filled red diamonds show the bolometric luminosity obtained using the bolometric corrections presented by Lyman et al. (2014). The best Arnett fit to this light curve is shown by a red dashed line. The best hydrodynamical model fit is shown by a thick dashed line. The best magnetar model is shown by a black dashed line. Central panel: BB-temperature evolution for iPTF15dtg, along with the temperature evolution of the best hydrodynamical model. Bottom panel: BB velocity (red diamonds) and Fe ii velocities for iPTF15dtg. The best hydrodynamical model fit is shown by a thick dashed line, the velocity adopted for the Arnett model is represented by a thin dashed line, and fits the Fe ii velocities around peak.
Current usage metrics show cumulative count of Article Views (full-text article views including HTML views, PDF and ePub downloads, according to the available data) and Abstracts Views on Vision4Press platform.
Data correspond to usage on the plateform after 2015. The current usage metrics is available 48-96 hours after online publication and is updated daily on week days.
Initial download of the metrics may take a while.