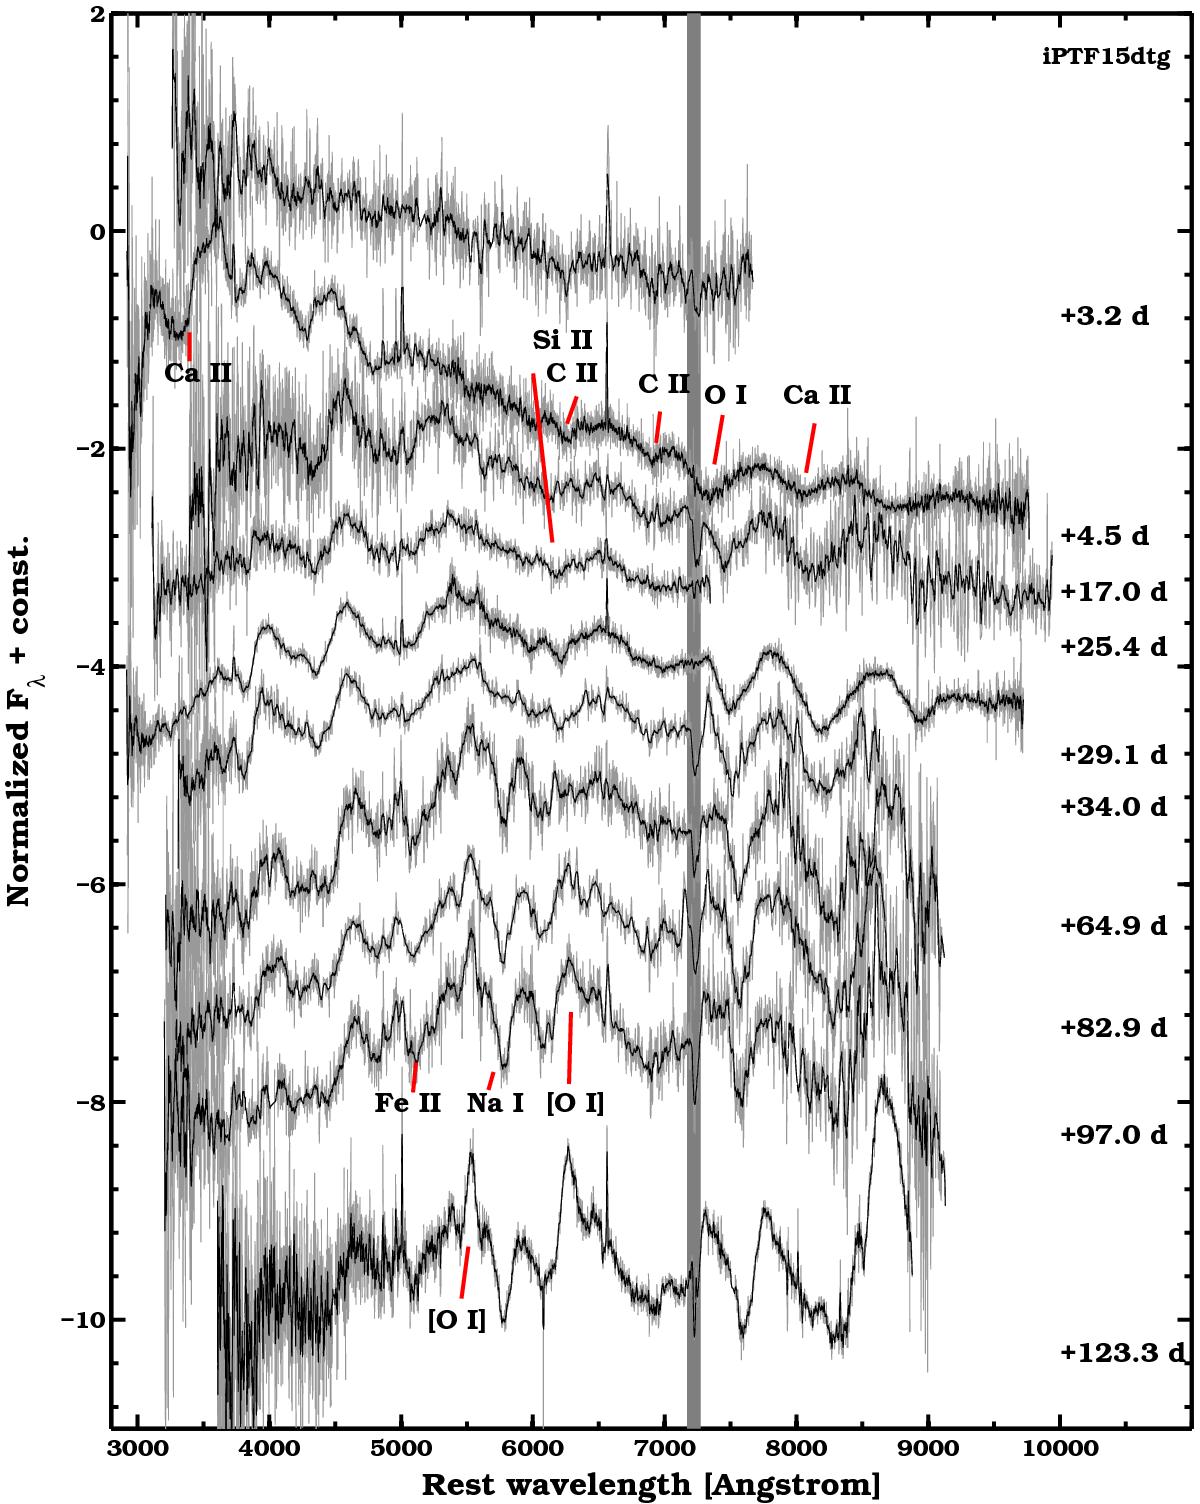
Fig. 5
Spectral sequence of iPTF15dtg. In gray, we show the unbinned spectra, in black the same spectra after smoothing. The spectra are normalized by their median and shifted vertically for clarity. The spectra are de-redshifted but they are not corrected for extinction. For each spectrum we report its phase (in days since explosion). The main telluric feature is indicated by a gray area. Line identifications are reported for some of the main features.
Current usage metrics show cumulative count of Article Views (full-text article views including HTML views, PDF and ePub downloads, according to the available data) and Abstracts Views on Vision4Press platform.
Data correspond to usage on the plateform after 2015. The current usage metrics is available 48-96 hours after online publication and is updated daily on week days.
Initial download of the metrics may take a while.