Fig. 3
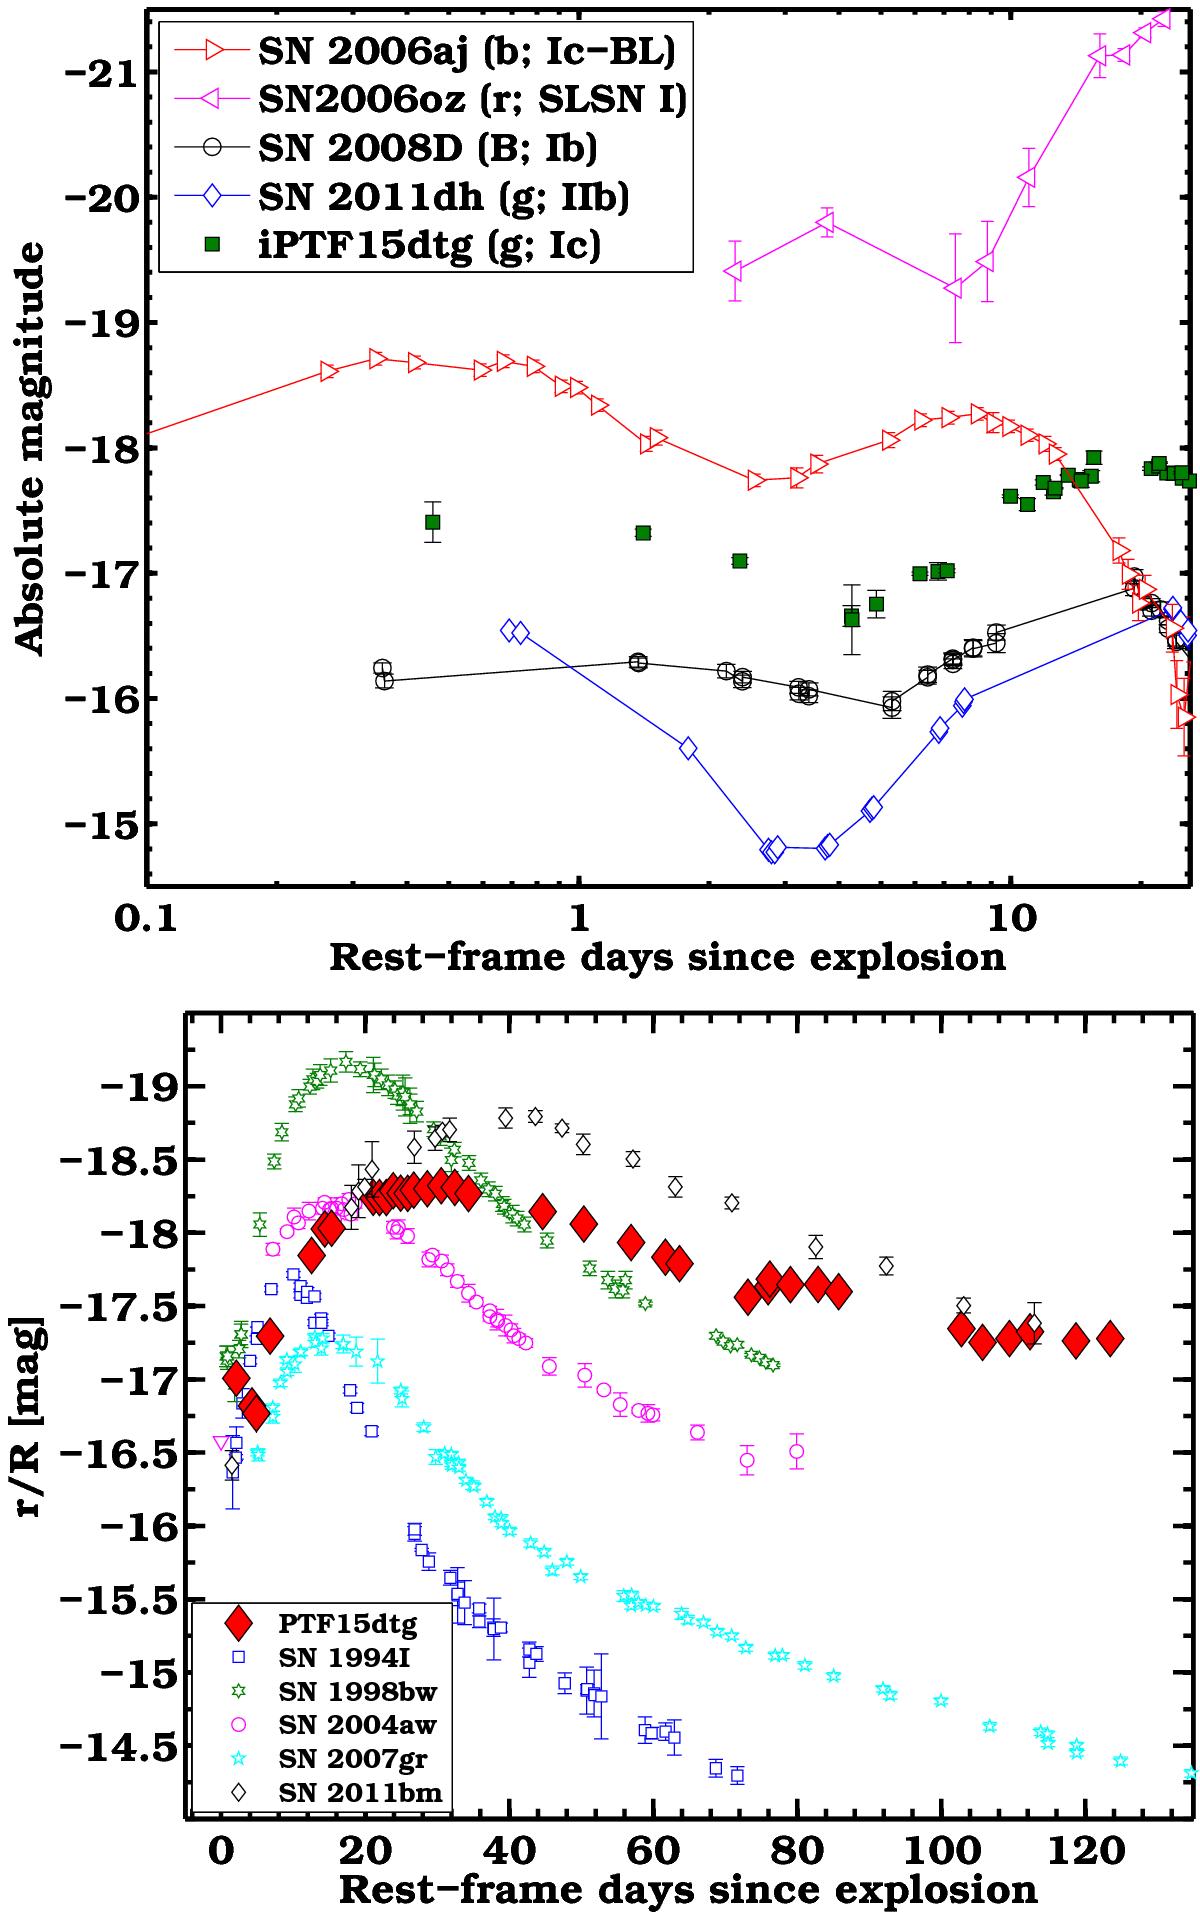
Top panel: comparison of the early g-band light curve of iPTF15dtg to the early light curves of other SE SNe and SLSNe that exhibit a double peak. For each SN the filter and the SN type is reported in the legend. The data for SNe 2006aj, 2006oz, 2008D, and 2011dh are taken from Brown et al. (2009), Leloudas et al. (2012), Bianco et al. (2014), and Arcavi et al. (2011), respectively. Bottom panel: absolute r-band magnitudes of iPTF15dtg compared to those of other well-studied SNe Ic from the literature. Data for SNe 1994I, 1998bw, 2004aw, 2007gr, 2011bm are from Richmond et al. (1996), Clocchiatti et al. (2011), Taubenberger et al. (2006), Hunter et al. (2009), Valenti et al. (2012), respectively.
Current usage metrics show cumulative count of Article Views (full-text article views including HTML views, PDF and ePub downloads, according to the available data) and Abstracts Views on Vision4Press platform.
Data correspond to usage on the plateform after 2015. The current usage metrics is available 48-96 hours after online publication and is updated daily on week days.
Initial download of the metrics may take a while.