Fig. 2
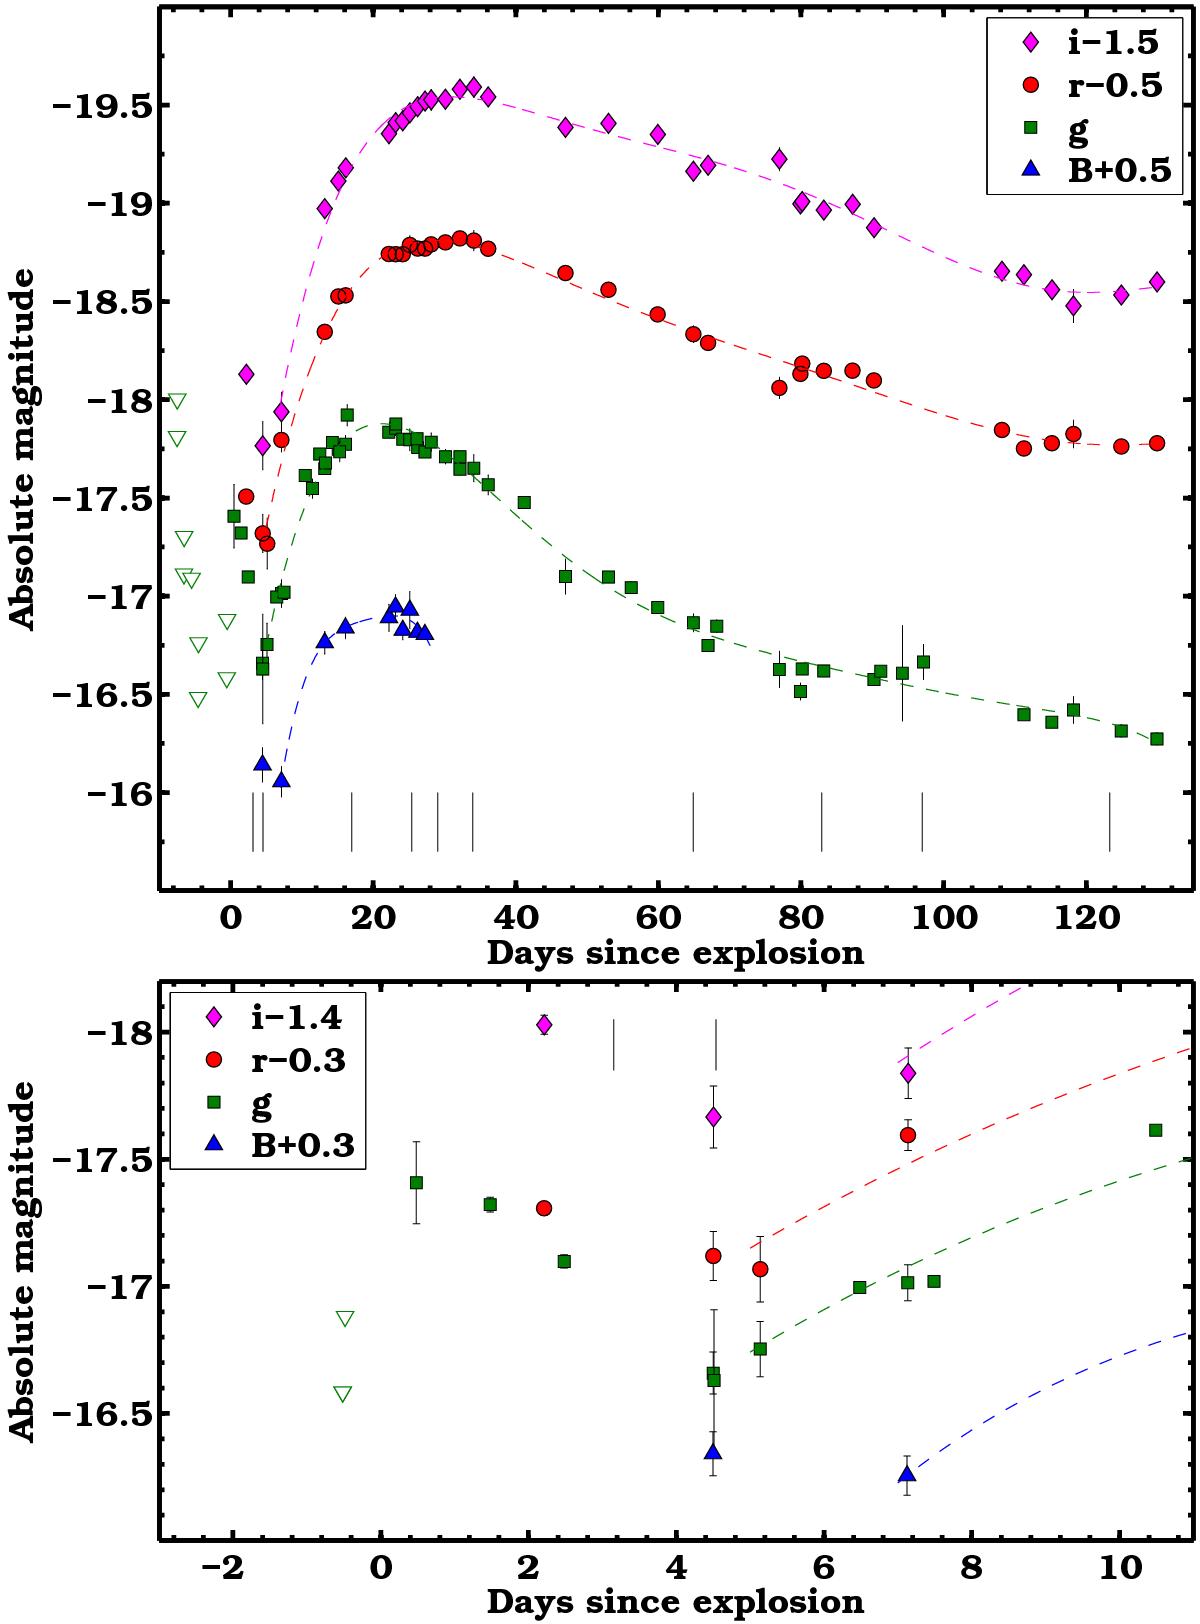
Top panel: Bgri absolute-magnitude light curves of iPTF15dtg from P48, P60, and NOT. The main peak is fit by low-order polynomials, shown as dashed lines. The epochs of spectral observations are indicated by vertical black segments. Pre-explosion magnitude limits in the g-band are indicated by triangles. In the gri filters, we notice the presence of an early peak, unprecented among spectroscopically normal SNe Ic. Bottom panel: the early Bgri light curves of iPTF15dtg.
Current usage metrics show cumulative count of Article Views (full-text article views including HTML views, PDF and ePub downloads, according to the available data) and Abstracts Views on Vision4Press platform.
Data correspond to usage on the plateform after 2015. The current usage metrics is available 48-96 hours after online publication and is updated daily on week days.
Initial download of the metrics may take a while.