Fig. 14
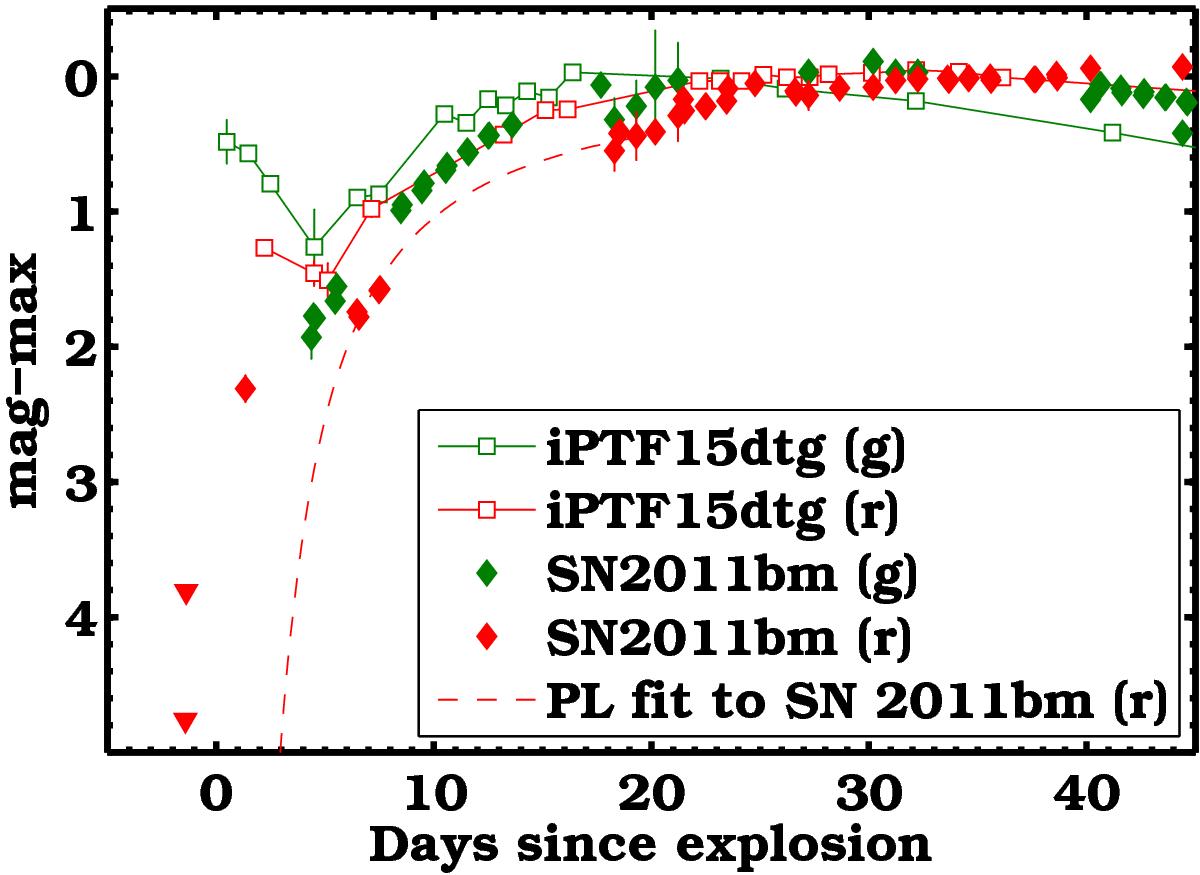
Early time light curves (g and r-band) of iPTF15dtg (empty symbols) and SN 2011bm(=PTF11bov, filled symbols), with data from PTF and Valenti et al. (2012). Light curves are scaled to maximum. The early r-band data points reveal that there could be an excess in the emission of SN 2011bm, similar to what is observed for iPTF15dtg. The best power-law fit to the early data of SN 2011bm (excluding the first epoch) is shown by a dashed line.
Current usage metrics show cumulative count of Article Views (full-text article views including HTML views, PDF and ePub downloads, according to the available data) and Abstracts Views on Vision4Press platform.
Data correspond to usage on the plateform after 2015. The current usage metrics is available 48-96 hours after online publication and is updated daily on week days.
Initial download of the metrics may take a while.