Fig. 8
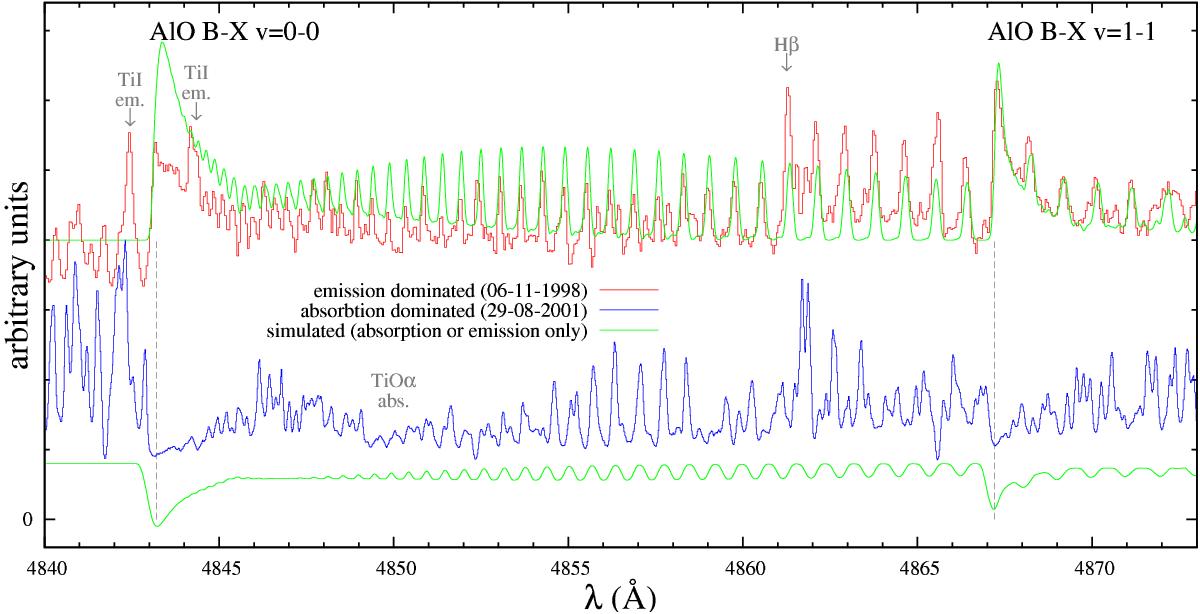
Sample optical spectra of AlO in two epochs (red and blue), covering the heads of the (0, 0) and (1, 1) bands and their rotational combs. Simple simulations (green) illustrate the location of the emission and absorption components. Many spectral features are of atomic origin. The reason for the poor correspondance of the observation and simulation at the (0, 0) bandhead of AlO is the lack of an underlying absorption feature in the similation and a limited correction for optical thickness, which is highest near the head. All spectra covering these and other bands of AlO at different dates are shown in Figs. C.2−C.5.
Current usage metrics show cumulative count of Article Views (full-text article views including HTML views, PDF and ePub downloads, according to the available data) and Abstracts Views on Vision4Press platform.
Data correspond to usage on the plateform after 2015. The current usage metrics is available 48-96 hours after online publication and is updated daily on week days.
Initial download of the metrics may take a while.