Fig. 7
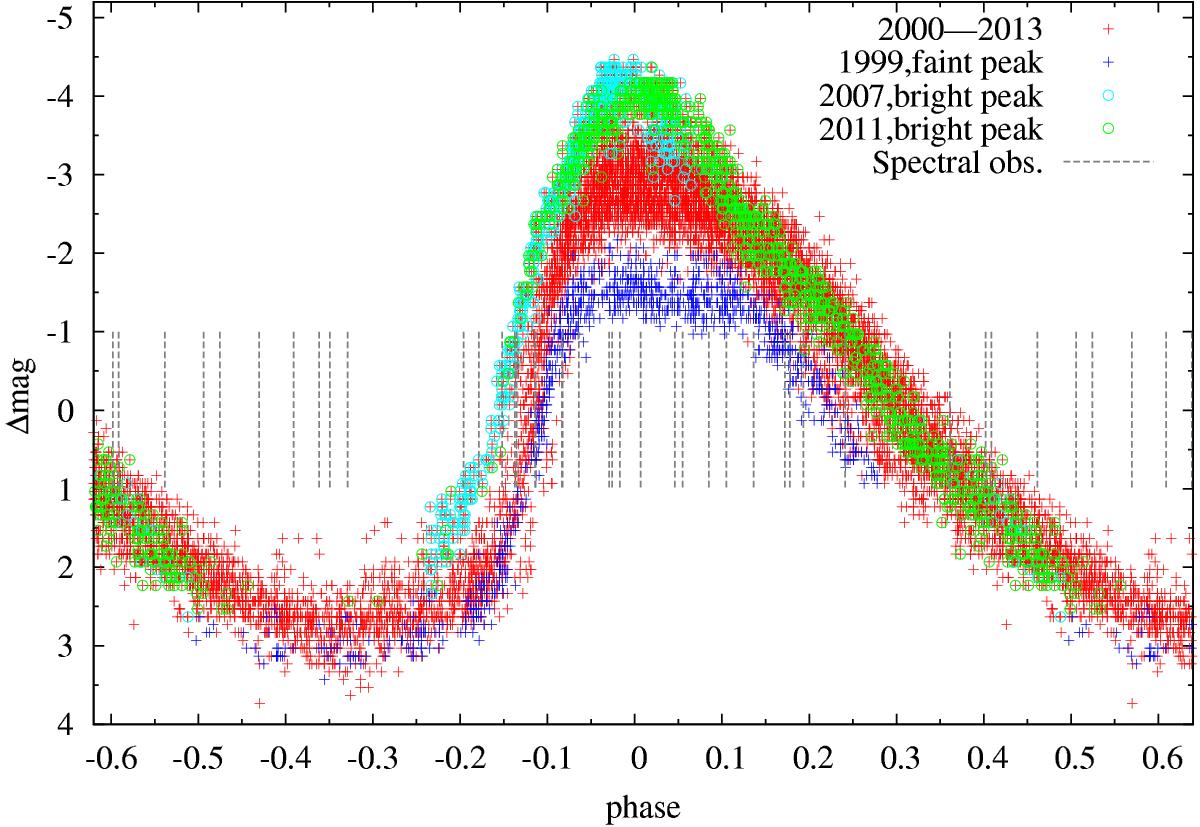
Phased AAVSO light curve of Mira in 1999−2013. The faint-maximum cycle of 1999 and the two recent cycles with bright maxima (2007 and 2011) are shown with blue, green, and cyan symbols, respectively. The dates of spectroscopic observations (Table 2) are marked with verical bars. For some dates, the corresponding bars appear twice in the graph, i.e. at ϕ and ϕ ± 1.
Current usage metrics show cumulative count of Article Views (full-text article views including HTML views, PDF and ePub downloads, according to the available data) and Abstracts Views on Vision4Press platform.
Data correspond to usage on the plateform after 2015. The current usage metrics is available 48-96 hours after online publication and is updated daily on week days.
Initial download of the metrics may take a while.