Fig. 6
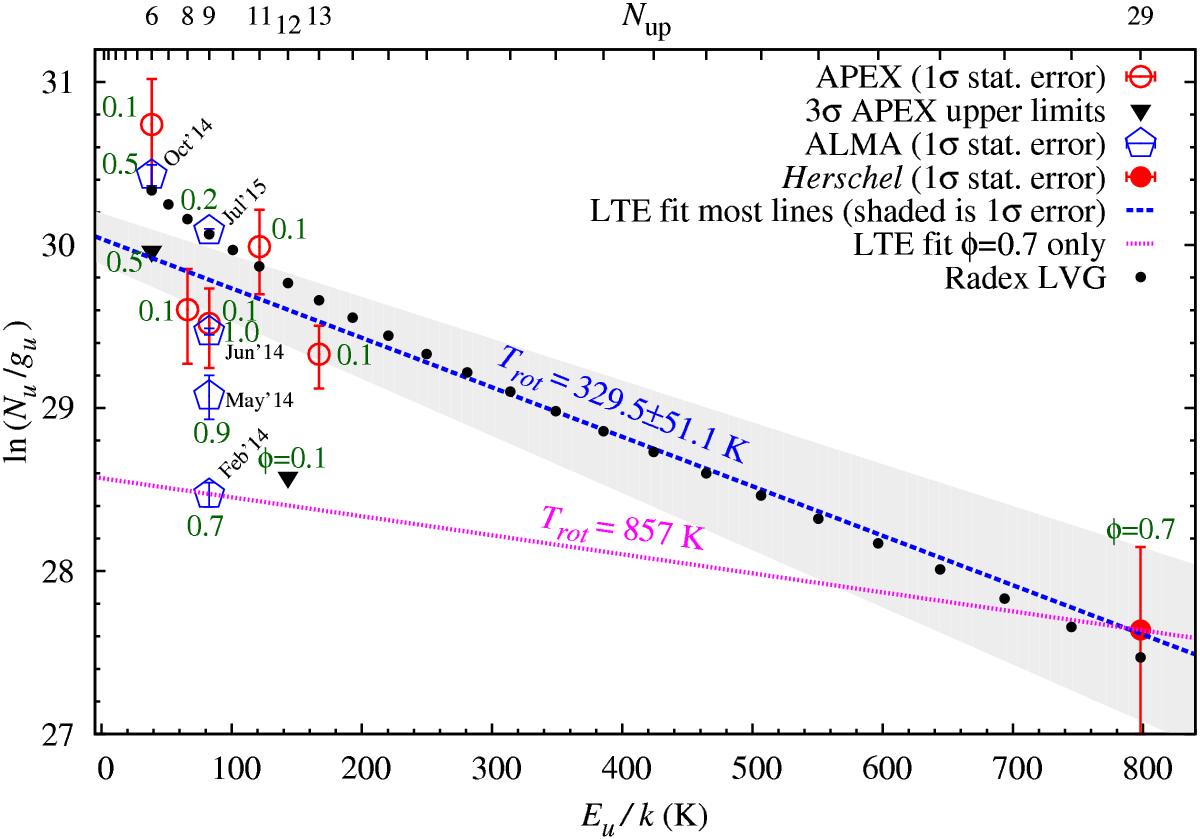
Population diagram for AlO. Circles and pentagons respresent detected lines, while triangles mark upper limits. The dashed blue line is the LTE linear fit to most of the detected lines (see text). The dotted magenta line is a fit to the two points with ϕ = 0.7. Black filled circles correspond to a non-LTE RADEX model with nearly the same parameters as constrained in the LTE fit and with H2 density of 109 cm-3. Numbers in green show the visual phase corresponding to the datapoints.
Current usage metrics show cumulative count of Article Views (full-text article views including HTML views, PDF and ePub downloads, according to the available data) and Abstracts Views on Vision4Press platform.
Data correspond to usage on the plateform after 2015. The current usage metrics is available 48-96 hours after online publication and is updated daily on week days.
Initial download of the metrics may take a while.