Fig. 5
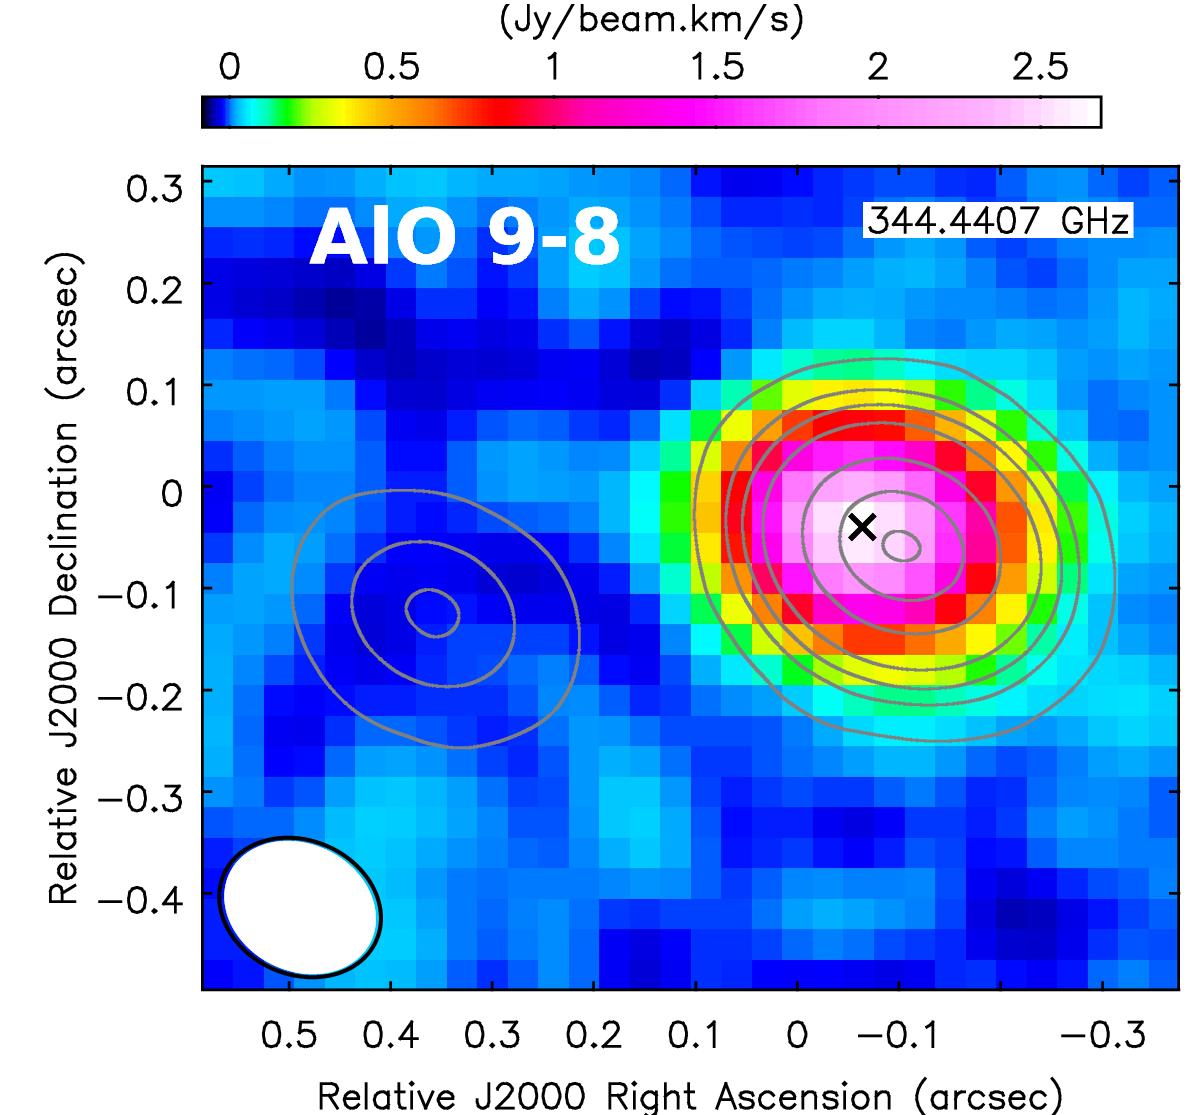
Same as Fig. 3, but for the N = 9 → 8 transition of AlO observed with a lower angular resolution of 163 × 132 mas. The map shows a region of the sky ~4 times larger than in Fig. 3 and also encompases Mira B (left continnum source). Gray contours show continuum emission of the binary at levels of 2.5, 5, 10, 30, 60, and 90% of the maximum. The center of the AlO emission, marked with a black cross, does not coincide with that of the continuum of Mira A.
Current usage metrics show cumulative count of Article Views (full-text article views including HTML views, PDF and ePub downloads, according to the available data) and Abstracts Views on Vision4Press platform.
Data correspond to usage on the plateform after 2015. The current usage metrics is available 48-96 hours after online publication and is updated daily on week days.
Initial download of the metrics may take a while.