Fig. 4
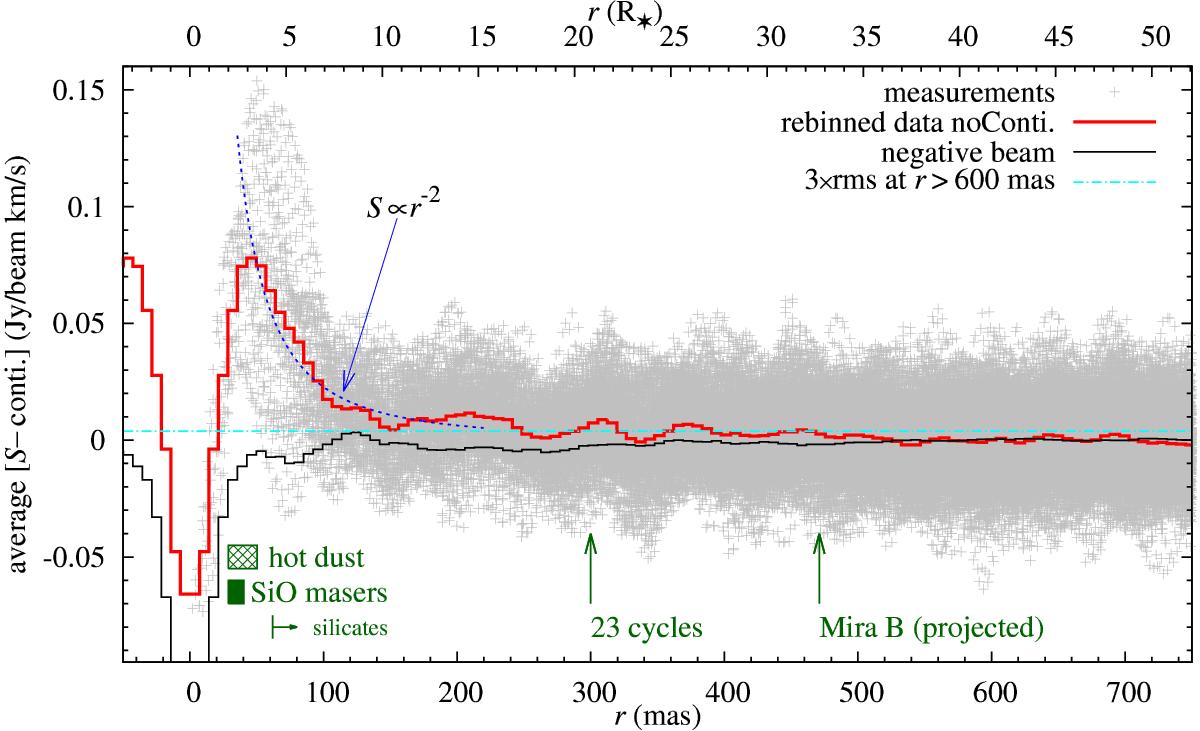
Radial profile of AlO emission. The gray points are brightness measurements, ![]() dν, of the AlO(6 → 5) line with ALMA plotted against the distance from the continuum peak. (They represent values of each pixel of the integrated-intensity map plotted against the radial distance of the pixel with respect to the star.) The red line is a binned average of those measurements mirrored around zero. The cyan dash-dot horizontal line marks the 3 × rms level measured beyond 0.̋6. The AlO emission can be traced above this 3 × rms level up to about 400 mas and the overall profile is well reproduced by a power law, with an example drawn with a dashed curve. Drawn with a black line is the azimuthally averaged dirty beam which was scaled and inverted in intensity to show the errorbeam structures corresponding to the strongest observed component of the profile. At the bottom of the plot, in green, are shown some characteristic locations within the envelope: the region closest to the star where hot dust has been observed in minimum (inner edge) and maximum light (outer edge) (Degiacomi et al. 1992); the range of SiO maser rings (Cotton et al. 2006); the innermost radius where silicate dust is observed in Mira stars marked as “silicates” (Karovicova et al. 2013; Wong et al. 2016); the radius at which the wind arrives after 23 cycles (or 20.8 yr) at the terminal wind speed of 5 km s-1; and the projected location of Mira B.
dν, of the AlO(6 → 5) line with ALMA plotted against the distance from the continuum peak. (They represent values of each pixel of the integrated-intensity map plotted against the radial distance of the pixel with respect to the star.) The red line is a binned average of those measurements mirrored around zero. The cyan dash-dot horizontal line marks the 3 × rms level measured beyond 0.̋6. The AlO emission can be traced above this 3 × rms level up to about 400 mas and the overall profile is well reproduced by a power law, with an example drawn with a dashed curve. Drawn with a black line is the azimuthally averaged dirty beam which was scaled and inverted in intensity to show the errorbeam structures corresponding to the strongest observed component of the profile. At the bottom of the plot, in green, are shown some characteristic locations within the envelope: the region closest to the star where hot dust has been observed in minimum (inner edge) and maximum light (outer edge) (Degiacomi et al. 1992); the range of SiO maser rings (Cotton et al. 2006); the innermost radius where silicate dust is observed in Mira stars marked as “silicates” (Karovicova et al. 2013; Wong et al. 2016); the radius at which the wind arrives after 23 cycles (or 20.8 yr) at the terminal wind speed of 5 km s-1; and the projected location of Mira B.
Current usage metrics show cumulative count of Article Views (full-text article views including HTML views, PDF and ePub downloads, according to the available data) and Abstracts Views on Vision4Press platform.
Data correspond to usage on the plateform after 2015. The current usage metrics is available 48-96 hours after online publication and is updated daily on week days.
Initial download of the metrics may take a while.