Fig. 3
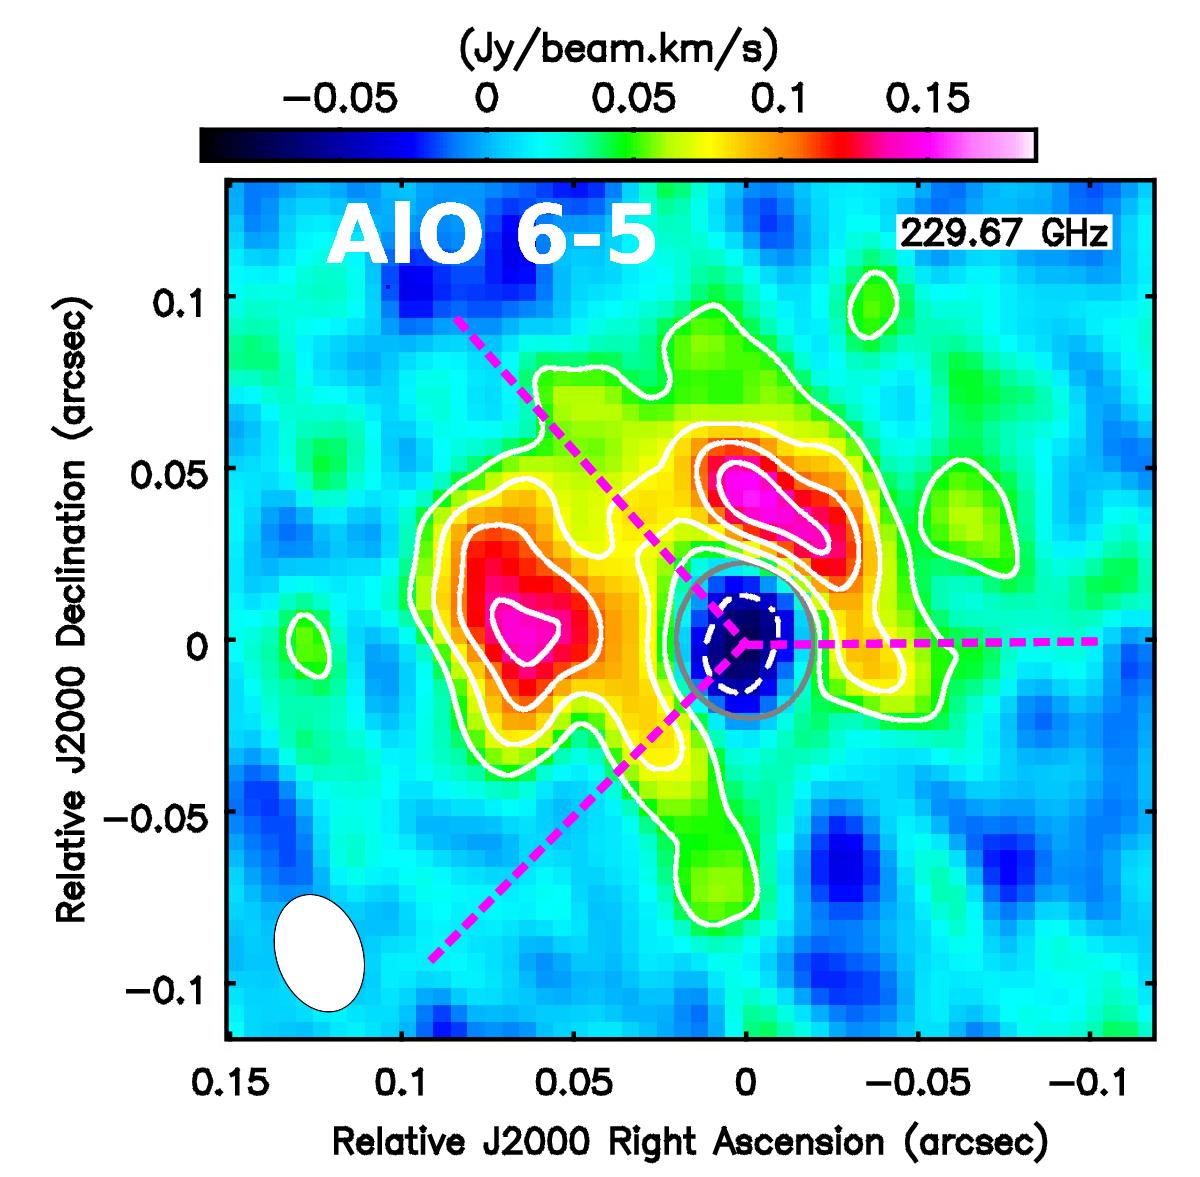
Integrated-intensity map of AlO emission in the N = 6 → 5 transition as observed with ALMA with a beam of 34 × 24 mas, shown as a white ellipse. White contours are drawn at −3 (dashed), 3, 4, 5, 6 times the map rms noise level of 15 mJy/beam km s-1. For comparison, the continuum emission is shown with a gray contour at 50% of its peak emission which represents the extend of the beam-smeared radio photosphere. The dashed lines (magenta) show the directions of spatial cuts which are presented in Fig. 9. The map was produced by using data processed in CLEAN after continuum subtraction.
Current usage metrics show cumulative count of Article Views (full-text article views including HTML views, PDF and ePub downloads, according to the available data) and Abstracts Views on Vision4Press platform.
Data correspond to usage on the plateform after 2015. The current usage metrics is available 48-96 hours after online publication and is updated daily on week days.
Initial download of the metrics may take a while.