Fig. 2
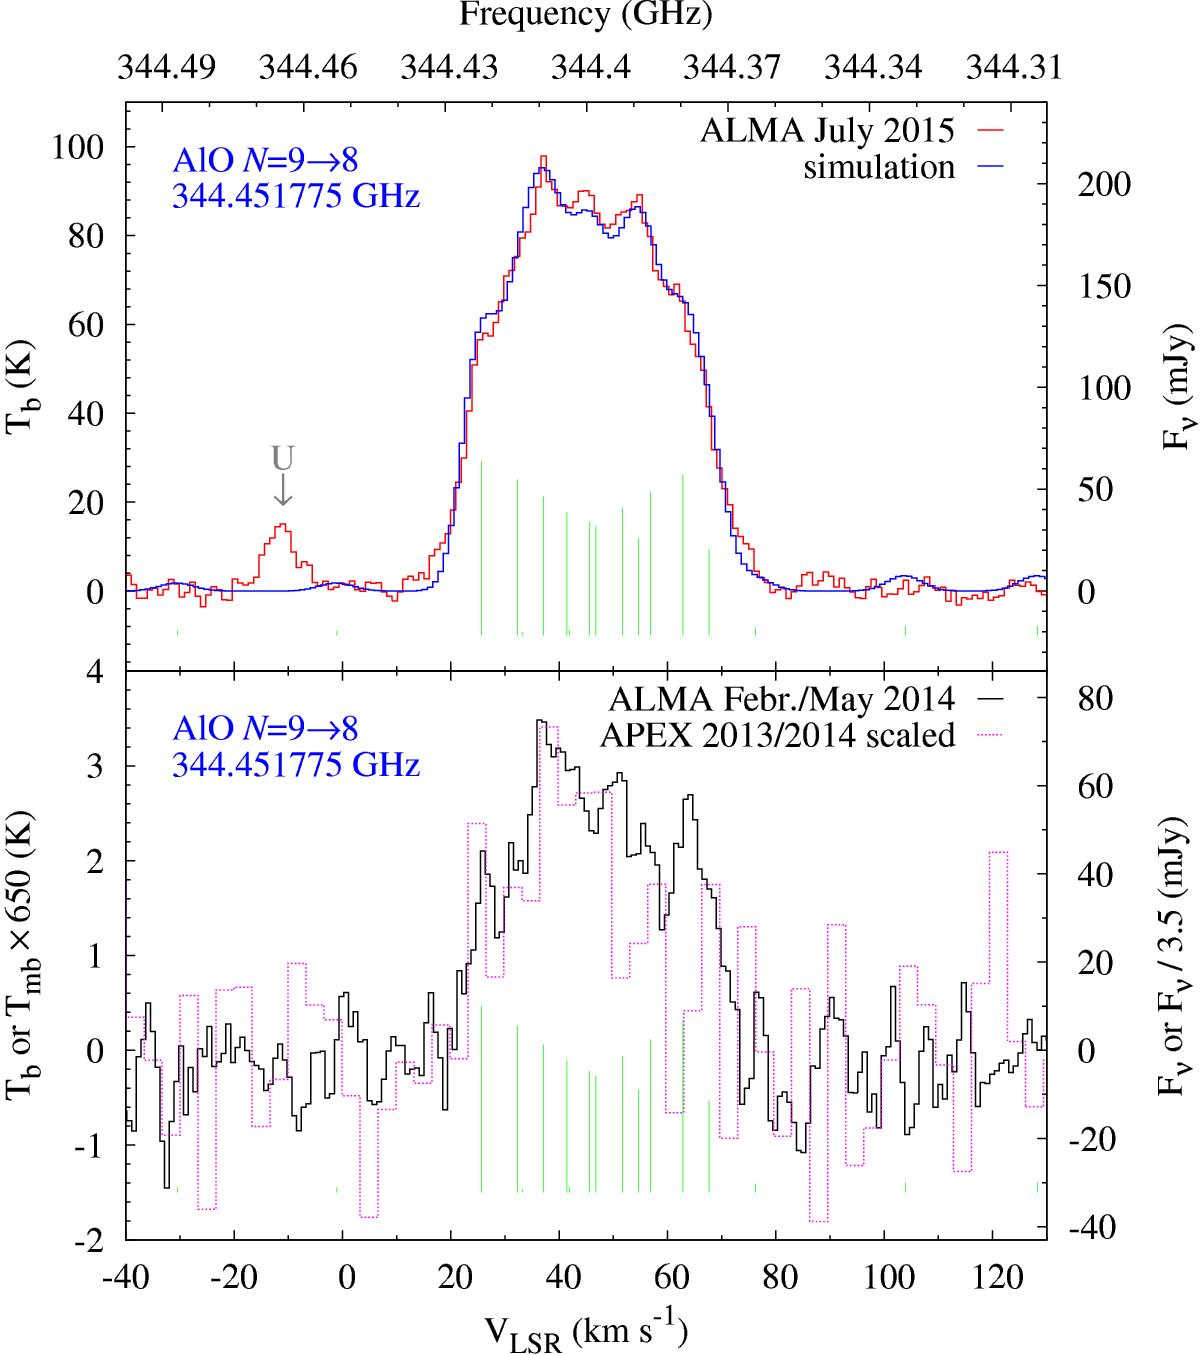
Top: AlO N = 9−8 spectrum observed with ALMA on 12 July 2015 (red line). This is the best-quality (S/N and spectral resolution) spectrum of this transition to date. It was extracted from a region where profile-integrated flux is above the 3 × rms noise level. Our simulation of the profile is drawn in blue (see text for details). The green vertical bars mark individual hyperfine components with the height of the bars corresponding to the relative line strength, Si, at VLSR of 46.9 km s-1. Bottom: the profiles of the same line in the APEX (magenta) and ALMA data from Feb. and May 2014 (black). Both spectra were smoothed for clarity. The APEX spectrum is scaled in intensity units.
Current usage metrics show cumulative count of Article Views (full-text article views including HTML views, PDF and ePub downloads, according to the available data) and Abstracts Views on Vision4Press platform.
Data correspond to usage on the plateform after 2015. The current usage metrics is available 48-96 hours after online publication and is updated daily on week days.
Initial download of the metrics may take a while.