Fig. C.1
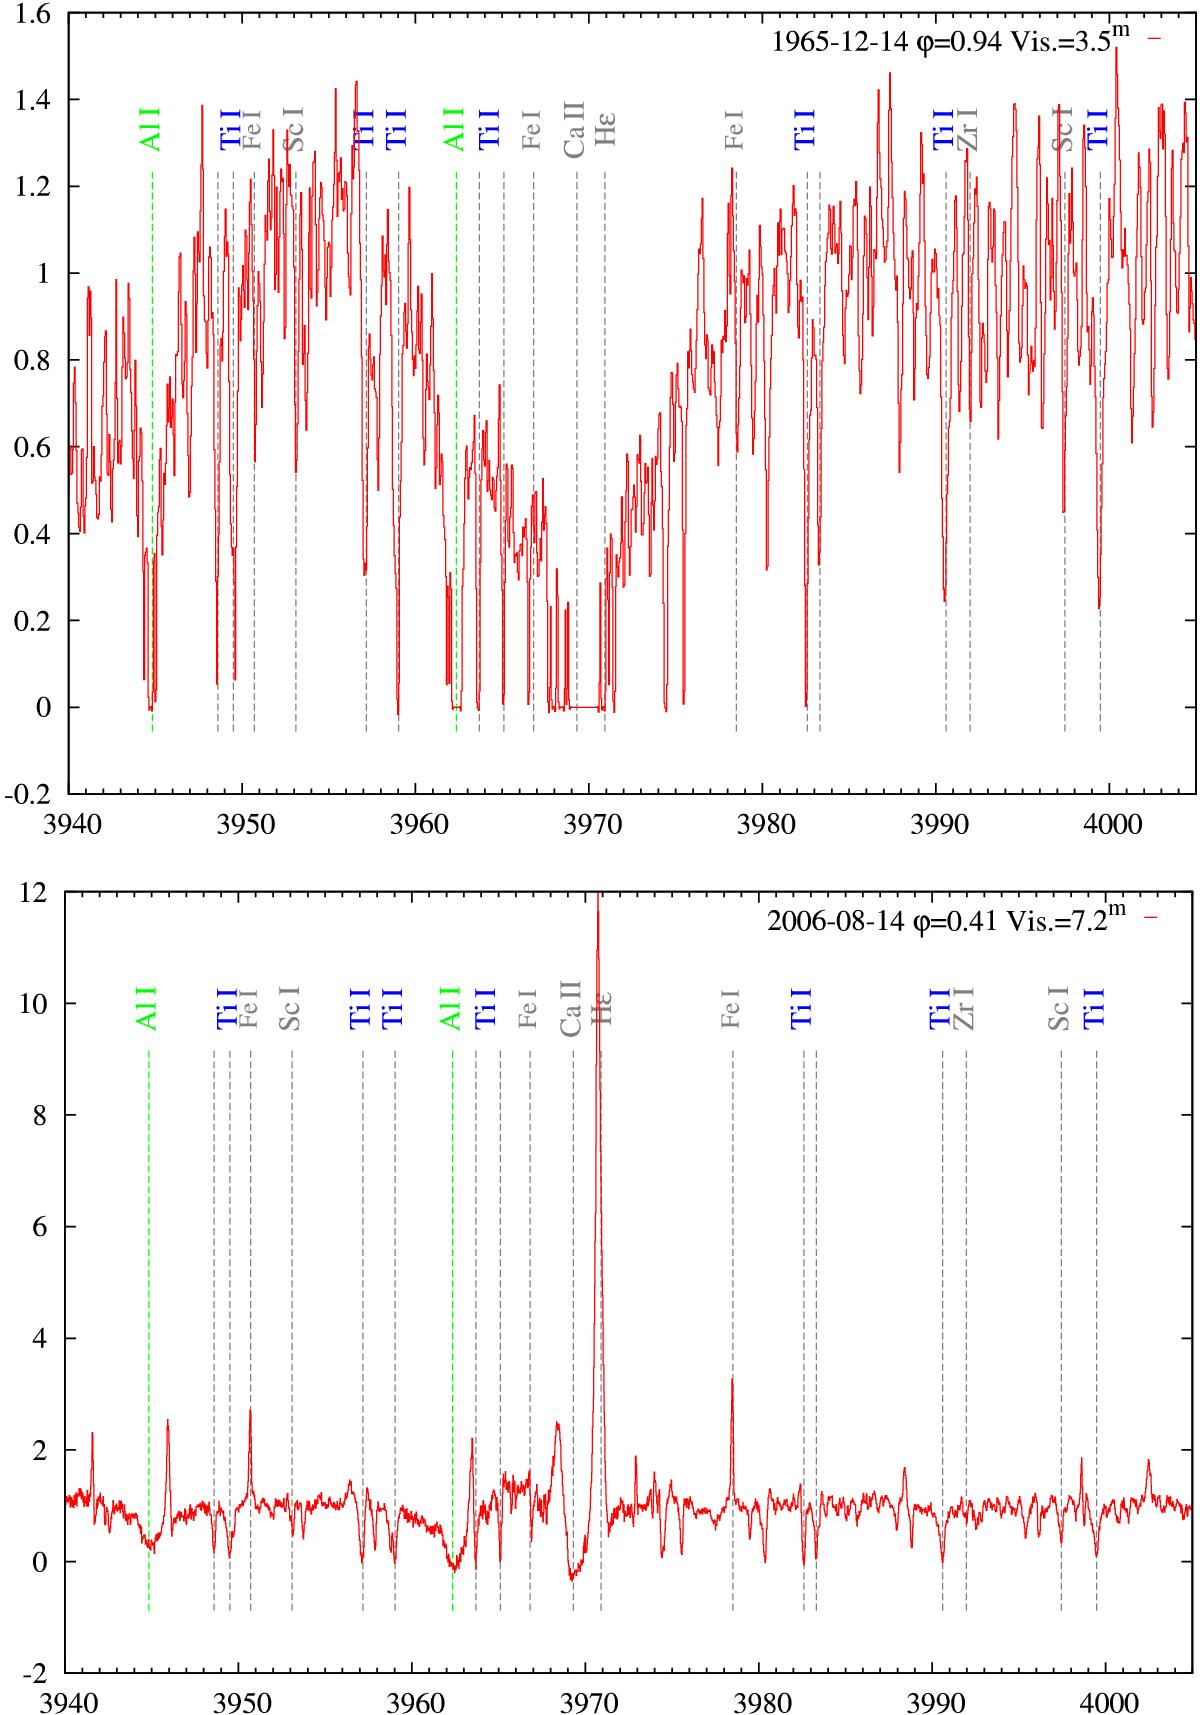
High-resolution optical spectra of Mira covering the resonance lines of Al i and Ti i. The date of observations and the corresponding phase and visual magnitude are specified in the upper right corner of each panel. All spectra were normalized with high-order polynomials. The pseudo-continuum in this spectral region is dominated by broad wings of the Ca ii doublet and the normalization partially removed its absorption. The normalization was optimised to better illustrate the shape of the Al i lines and to limit the scale of the figure. The imperfect normalization affects the apparent intensity ratio of the two lines of Al i. Some spectra were smoothed. Identification labels are shown for selected features at their approximate locations.
Current usage metrics show cumulative count of Article Views (full-text article views including HTML views, PDF and ePub downloads, according to the available data) and Abstracts Views on Vision4Press platform.
Data correspond to usage on the plateform after 2015. The current usage metrics is available 48-96 hours after online publication and is updated daily on week days.
Initial download of the metrics may take a while.