Fig. 5
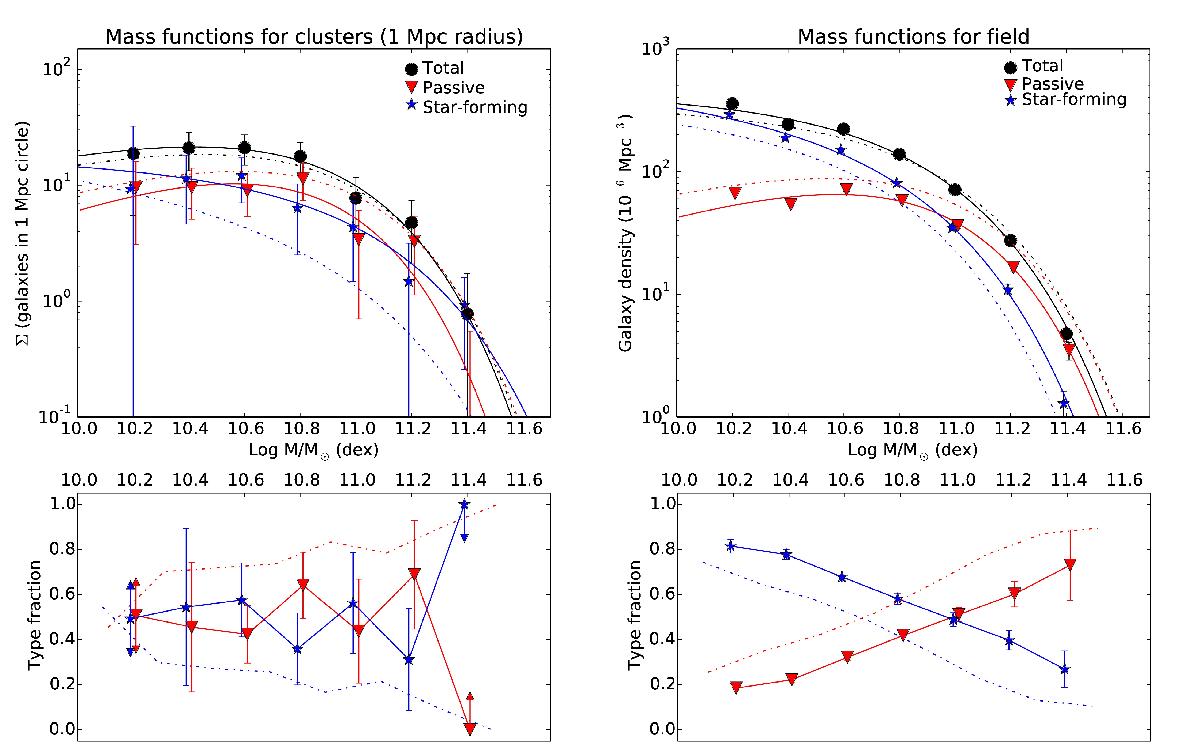
Stellar mass functions for cluster (left) and field (right) galaxies, showing both the data and the best Schechter function fits (top) and the type fractions in each mass bin (bottom) with red representing passive galaxies and blue representing star-forming galaxies. The dash-dot lines represent stellar mass functions and type fractions from van der Burg et al. (2013) normalized to match our data. Arrows for error bars represent unconstrained type fractions in a stellar mass bin. Passive and star-forming stellar mass data are offset horizontally by ±0.01 dex for clarity.
Current usage metrics show cumulative count of Article Views (full-text article views including HTML views, PDF and ePub downloads, according to the available data) and Abstracts Views on Vision4Press platform.
Data correspond to usage on the plateform after 2015. The current usage metrics is available 48-96 hours after online publication and is updated daily on week days.
Initial download of the metrics may take a while.