Fig. 3
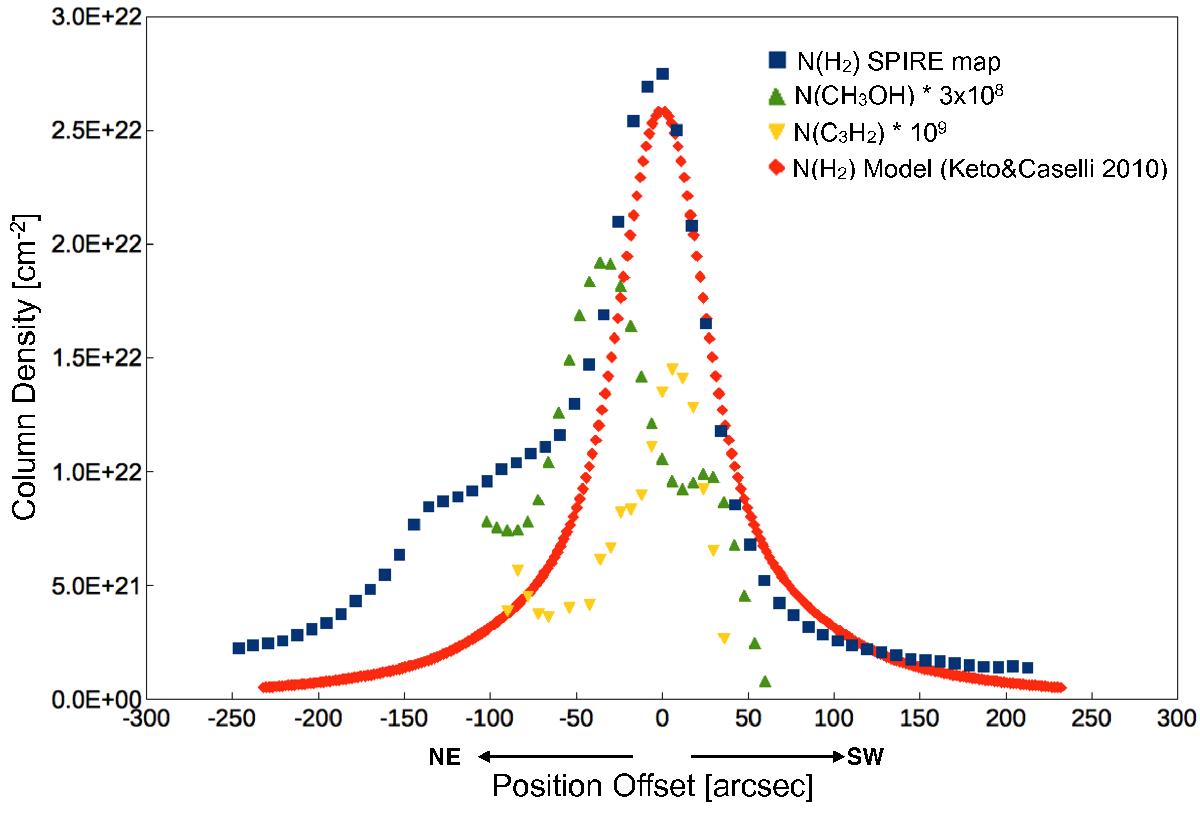
Column densities of H2, c-C3H2 and CH3OH extracted along the dotted line present in Fig. 1, as well as the N(H2) calculated with the model of L1544 described in Keto & Caselli (2010) smoothed at 40′′. While the N(H2) presents a sharp drop towards the south-west, its decrease is not as steep towards the north-east. The resulting different illumination on the two sides of L1544 is likely to cause the different distribution of cyclopropenylidene and methanol within the core.
Current usage metrics show cumulative count of Article Views (full-text article views including HTML views, PDF and ePub downloads, according to the available data) and Abstracts Views on Vision4Press platform.
Data correspond to usage on the plateform after 2015. The current usage metrics is available 48-96 hours after online publication and is updated daily on week days.
Initial download of the metrics may take a while.