Fig. 2
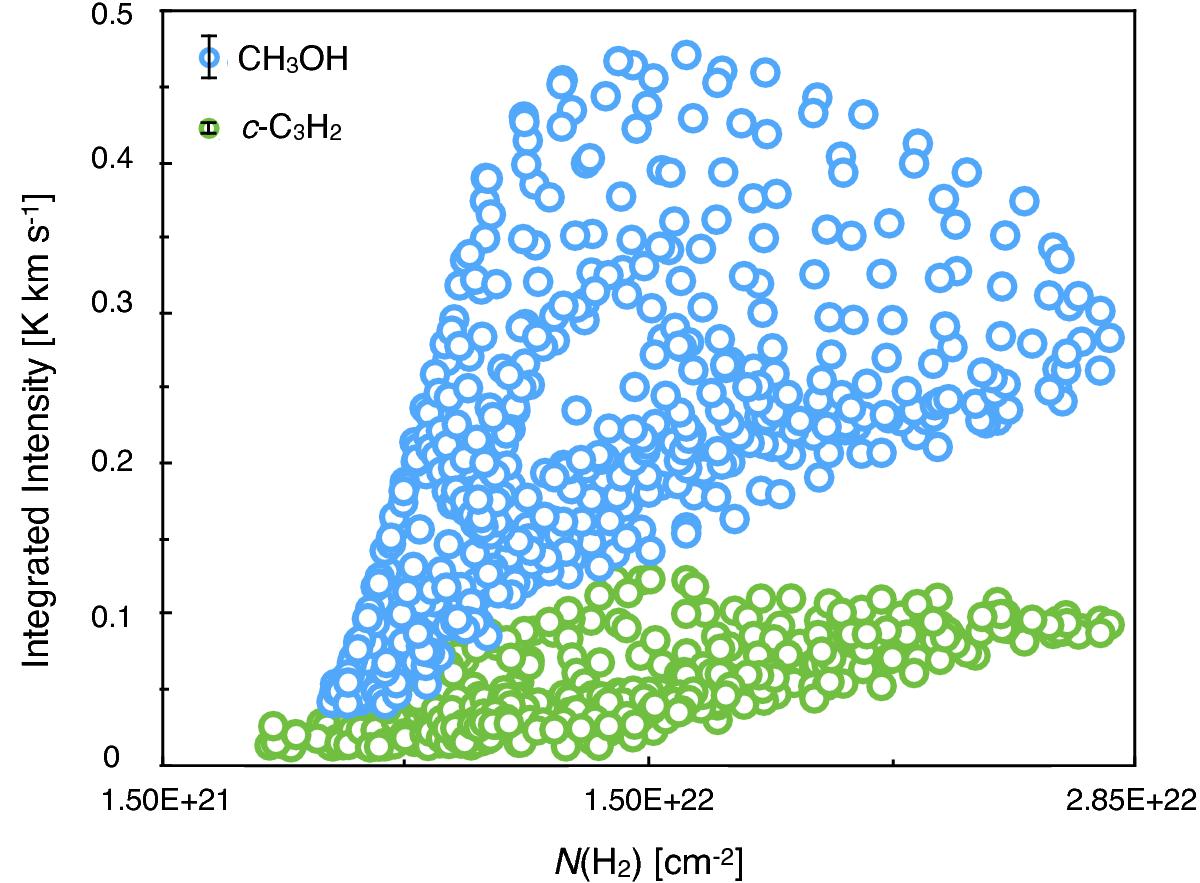
Scatter plot of the integrated intensities of the 21,2–11,1 (E2) CH3OH line (blue circles) and the 32,2–31,3c-C3H2 line (green circles) with respect to the H2 column density inferred from the SPIRE observations (see text). The average error bars are shown in the upper part of the plot. The average errors are 14 mK km s-1 for CH3OH and 4 mK km s-1 for c-C3H2. Only the pixels where the integrated intensity over the average error is larger than 3 are plotted.
Current usage metrics show cumulative count of Article Views (full-text article views including HTML views, PDF and ePub downloads, according to the available data) and Abstracts Views on Vision4Press platform.
Data correspond to usage on the plateform after 2015. The current usage metrics is available 48-96 hours after online publication and is updated daily on week days.
Initial download of the metrics may take a while.