Fig. 1
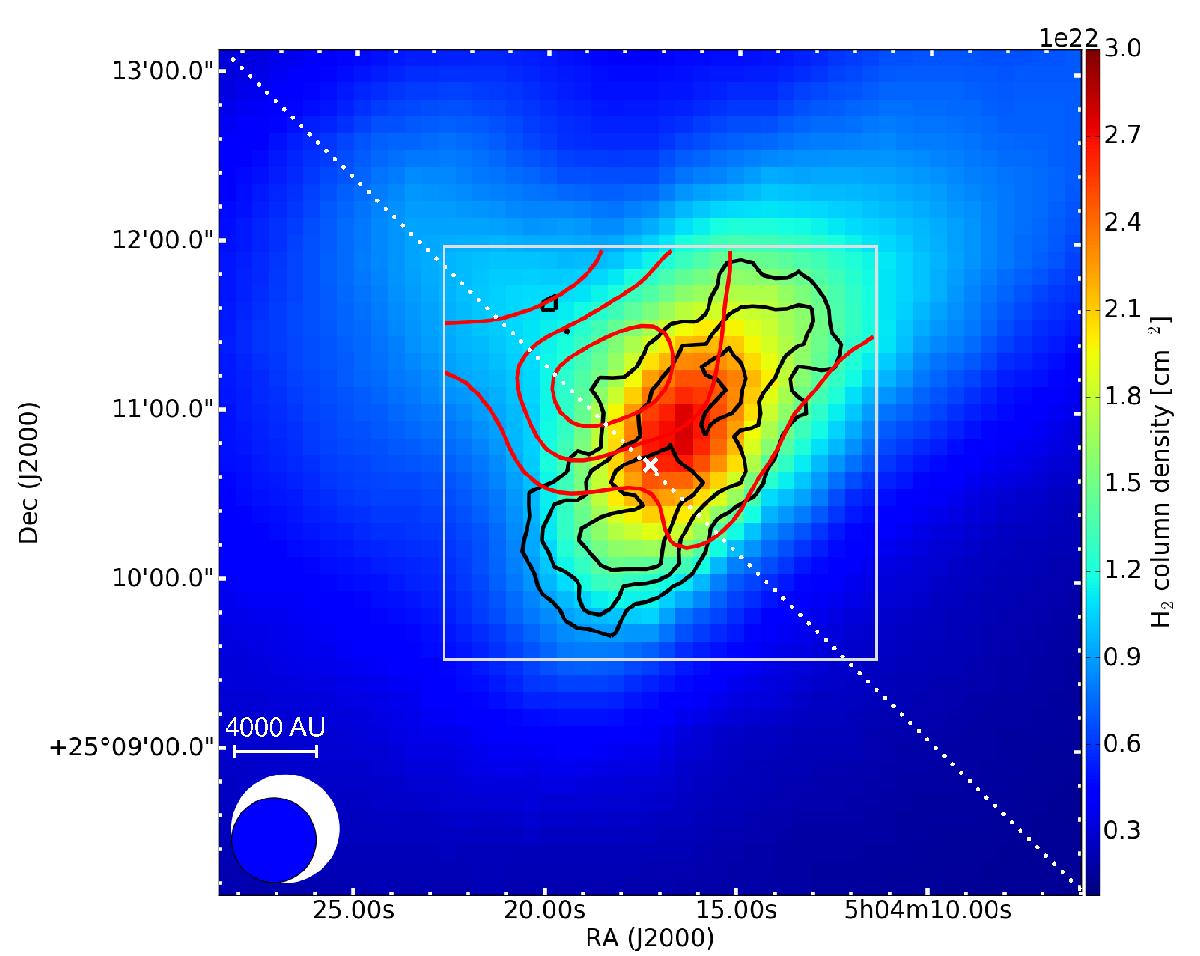
Integrated intensities of the 21,2–11,1 (E2) transition of methanol (red contour) and 32,2–31,3 transition of cyclopropenylidene (black contour) are plotted on the H2 column density map derived from far-infrared images observed by Herschel (Pilbratt et al. 2010). The contour levels are 10σ, 15σ, and 20σ CH3OH (2 × 10⁻¹, 3 × 10⁻¹ and 4 × 10⁻¹ K km s-1, respectively) and 5σ, 10σ, and 15σc-C3H2 (4.8 × 10⁻², 7.2 × 10⁻² and 9.6 × 10⁻² K km s-1, respectively). The white box defines the area that was mapped with the 30 m telescope. The white cross marks the position of the 1.2 mm dust emission peak from Ward-Thompson et al. (1999). The beams of SPIRE and of the 30 m telescope are shown as a white and blue circle, respectively. The dotted line represents the positions where the column densities plotted in Fig. 3 have been extracted. Methanol and cyclopropenylidene clearly trace different regions in L1544, and show a chemical differentiation within the prestellar core.
Current usage metrics show cumulative count of Article Views (full-text article views including HTML views, PDF and ePub downloads, according to the available data) and Abstracts Views on Vision4Press platform.
Data correspond to usage on the plateform after 2015. The current usage metrics is available 48-96 hours after online publication and is updated daily on week days.
Initial download of the metrics may take a while.