Free Access
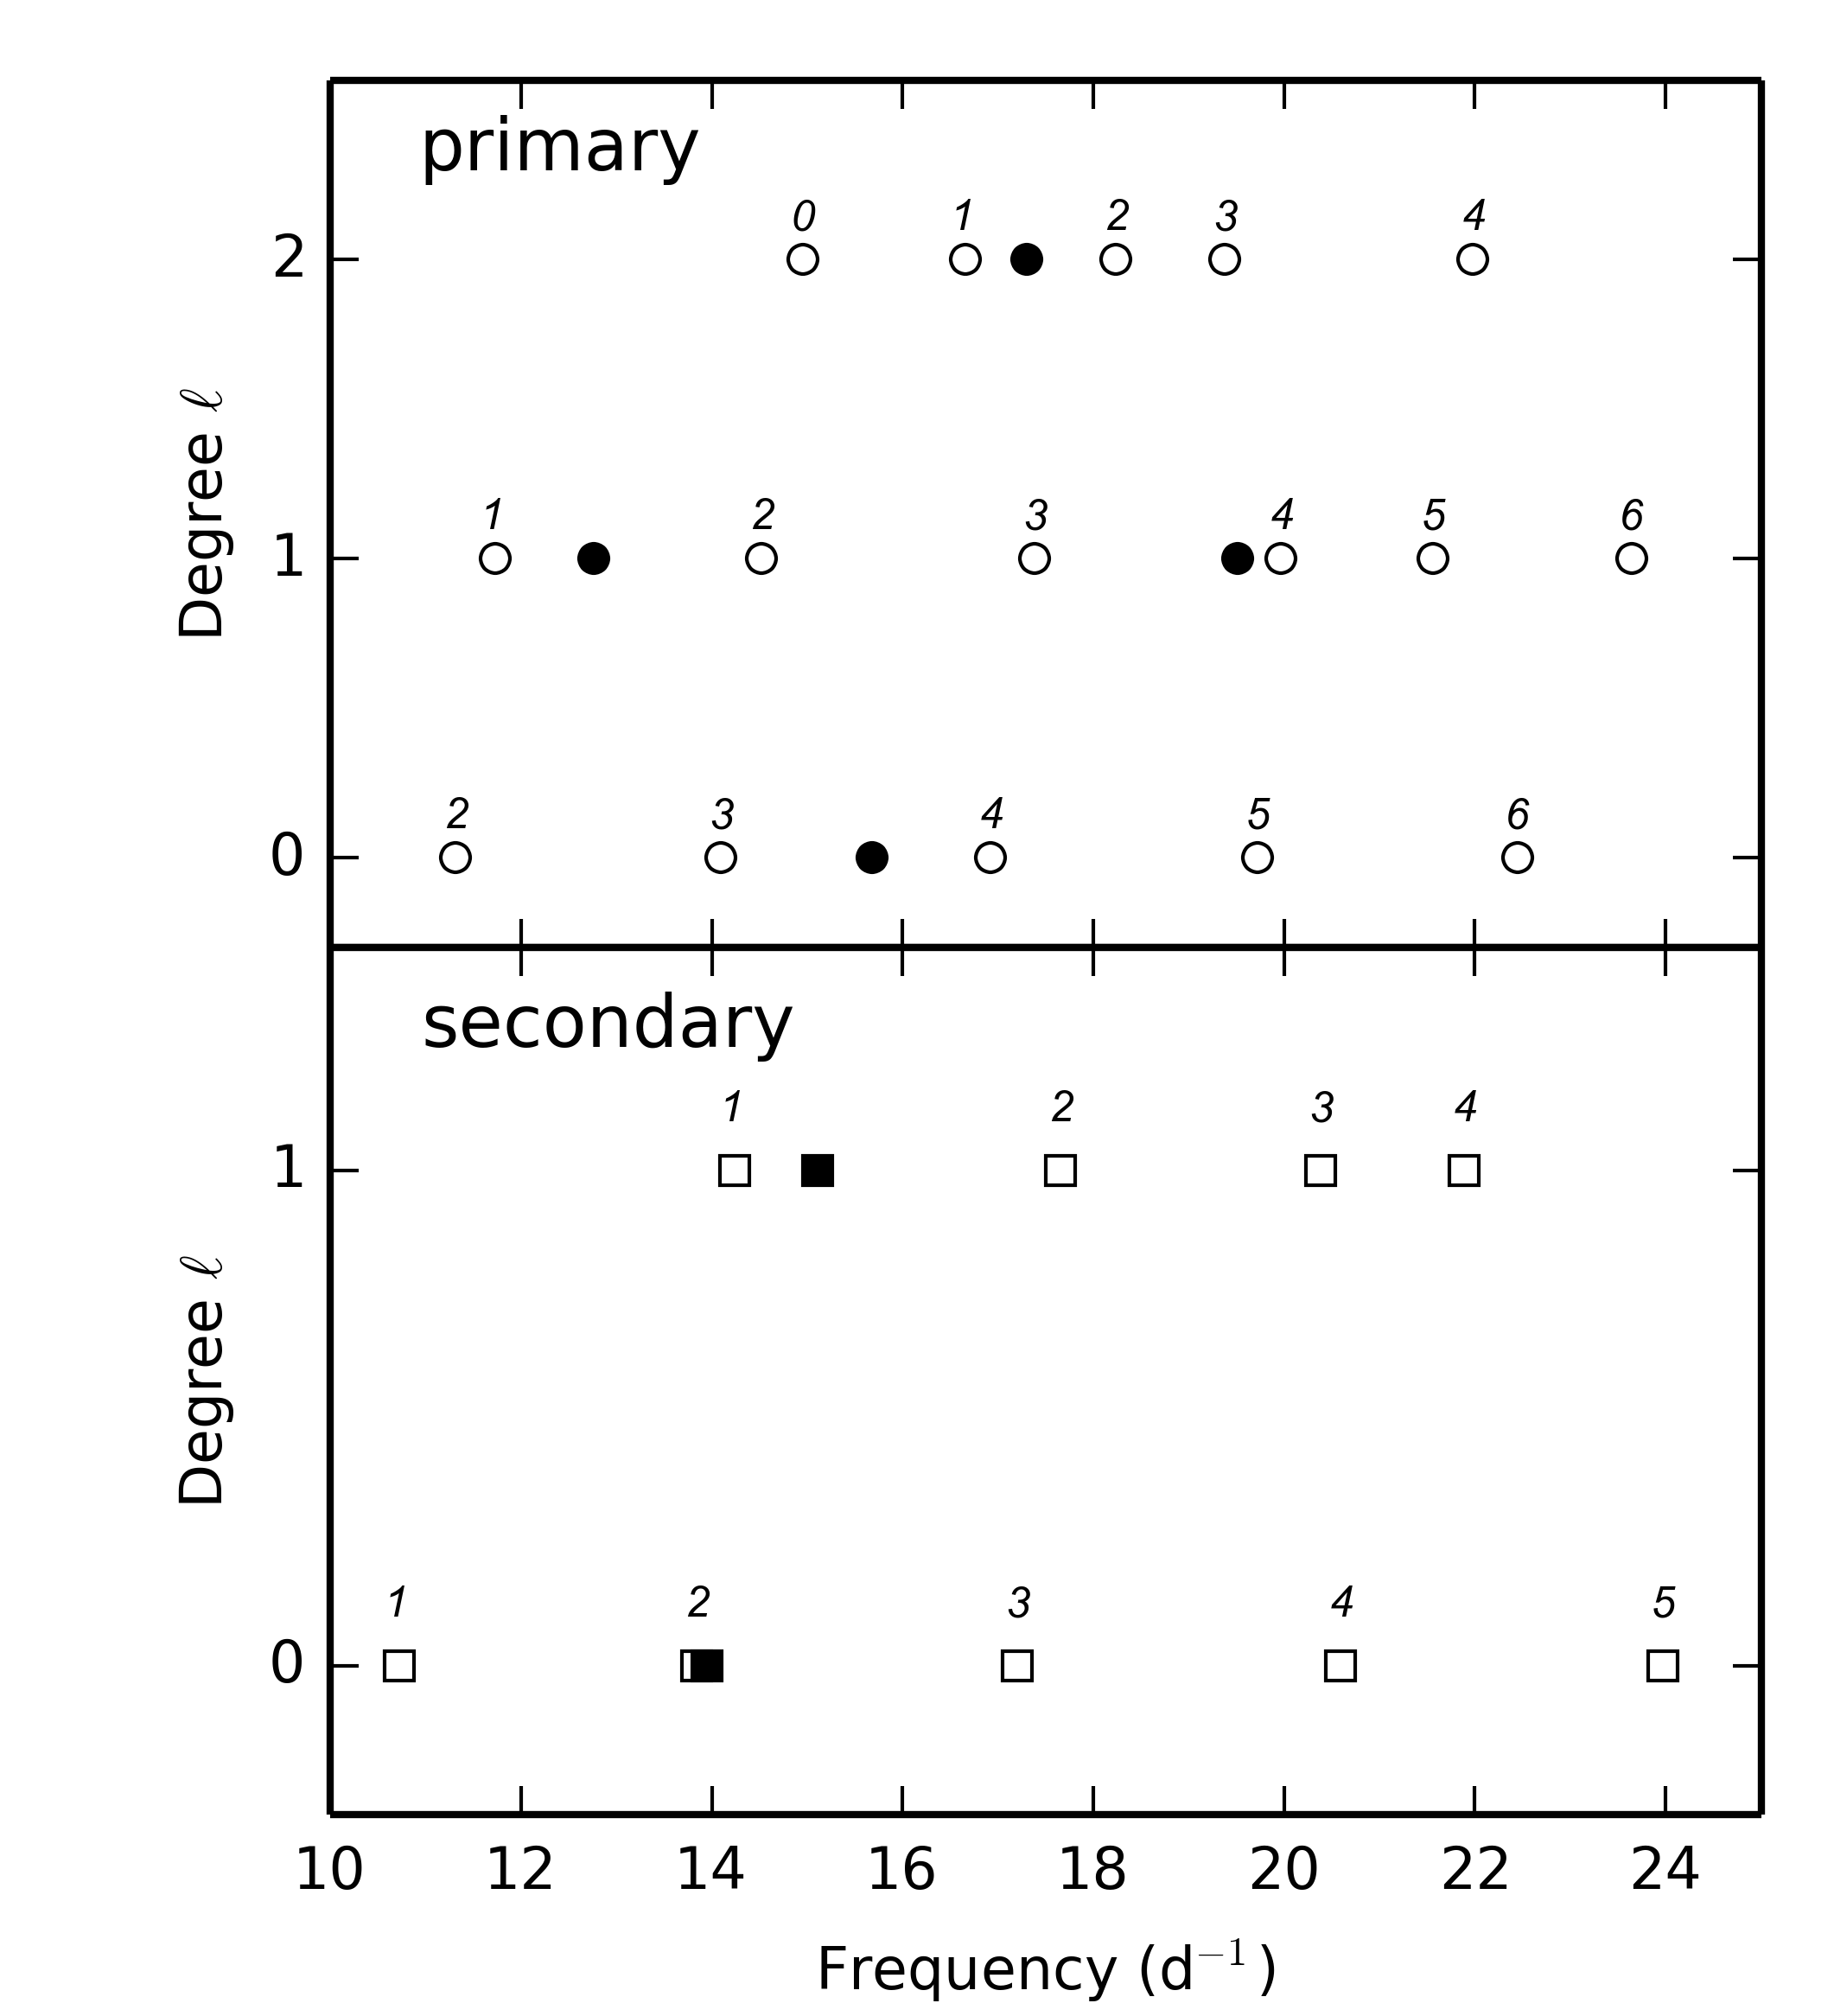
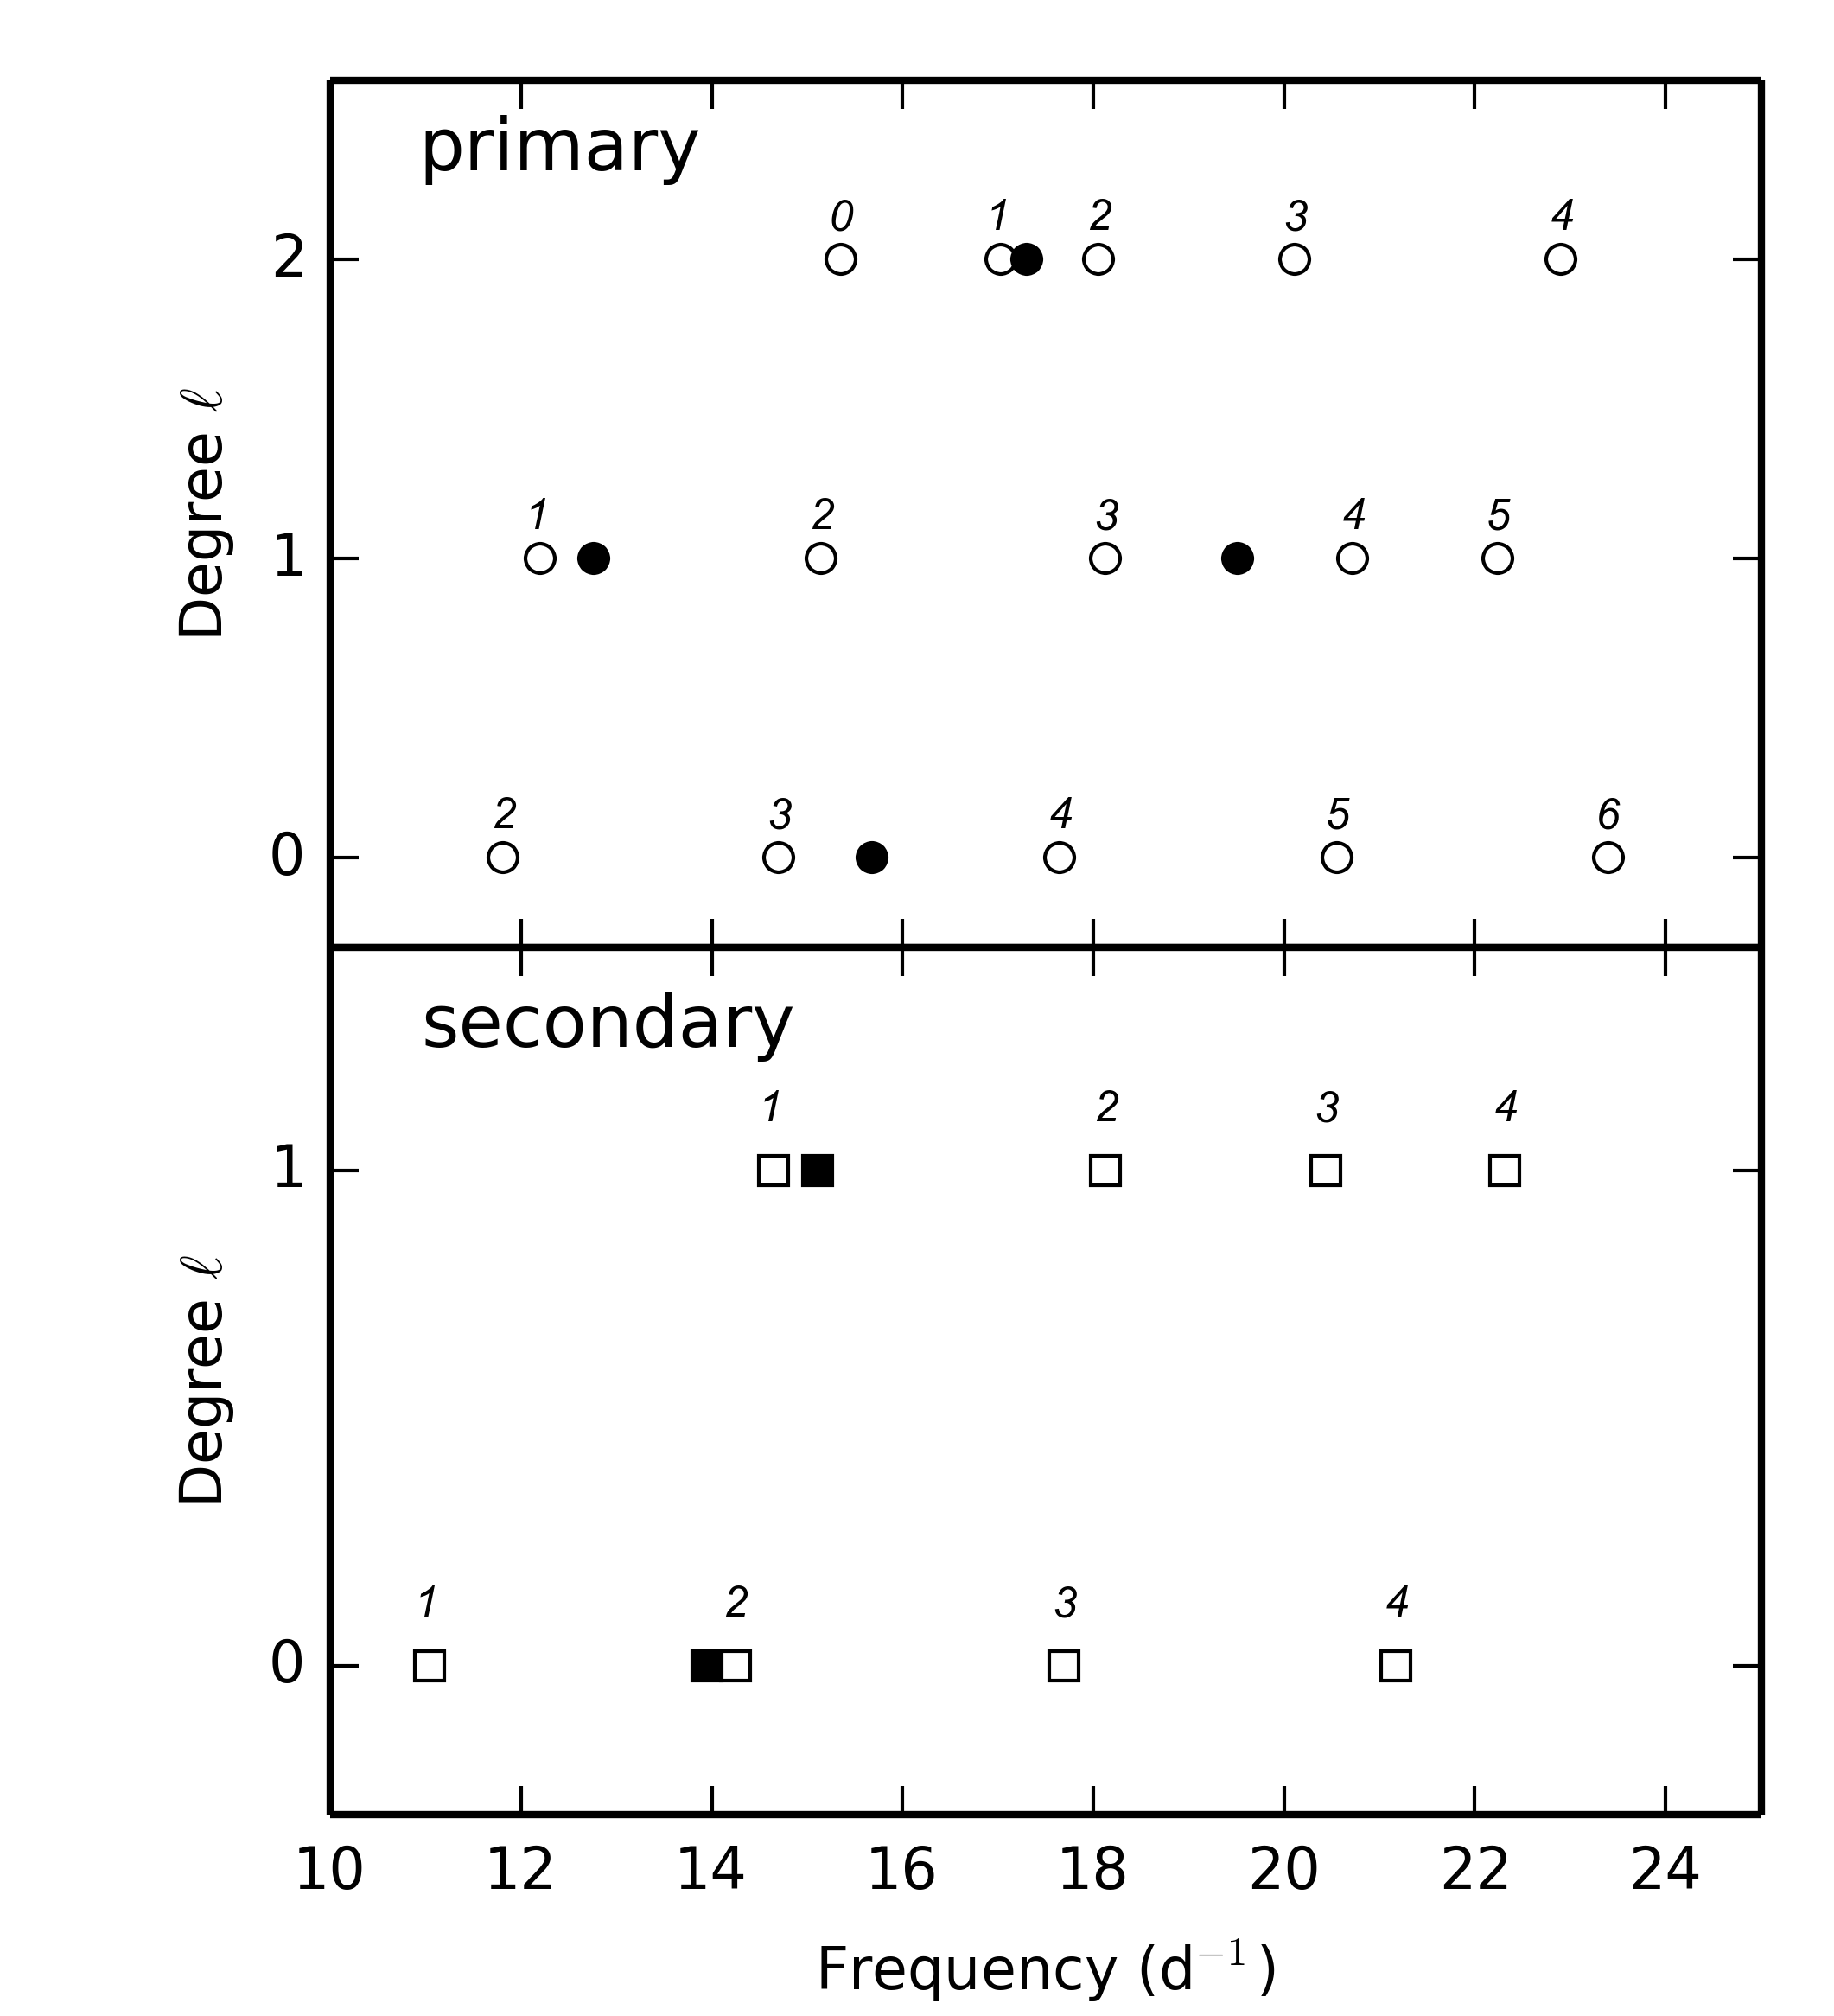
Fig. 7
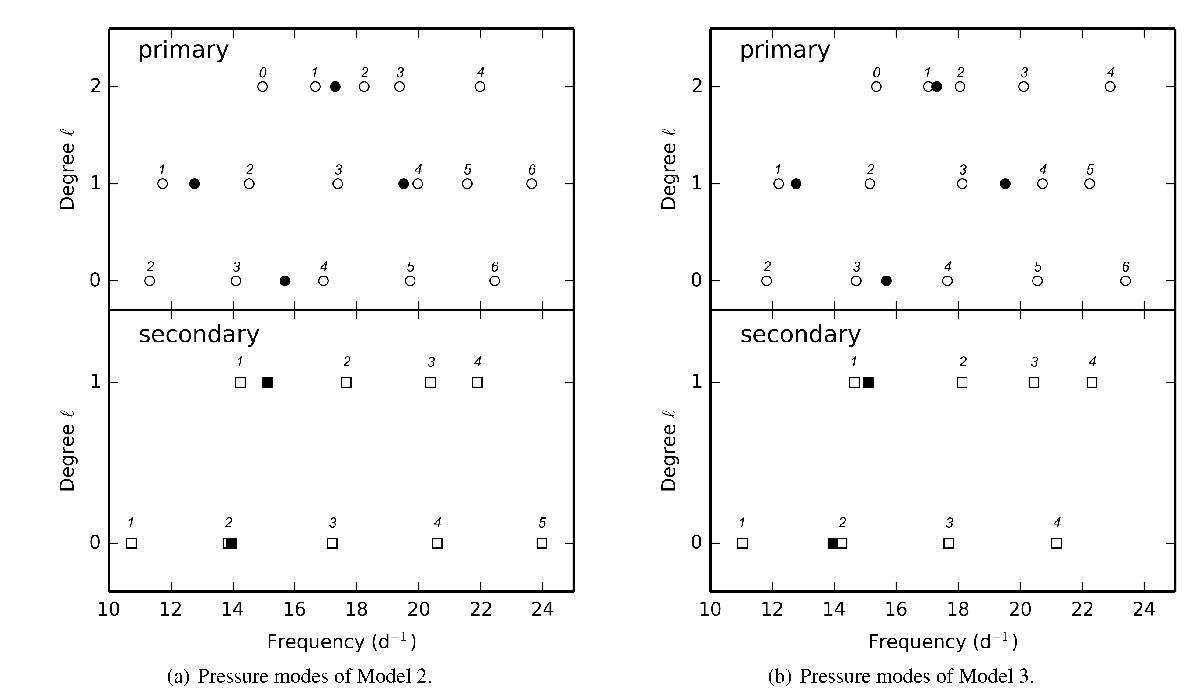
Comparison of the theoretical zonal p-modes (empty symbols) to the observed modes (filled symbols) as a function of degree ℓ. Modes of the primary are shown in the top panels and for the secondary in the bottom panels. The radial orders are given above the respective modes.
This figure is made of several images, please see below:

Current usage metrics show cumulative count of Article Views (full-text article views including HTML views, PDF and ePub downloads, according to the available data) and Abstracts Views on Vision4Press platform.
Data correspond to usage on the plateform after 2015. The current usage metrics is available 48-96 hours after online publication and is updated daily on week days.
Initial download of the metrics may take a while.