Free Access
Fig. 2
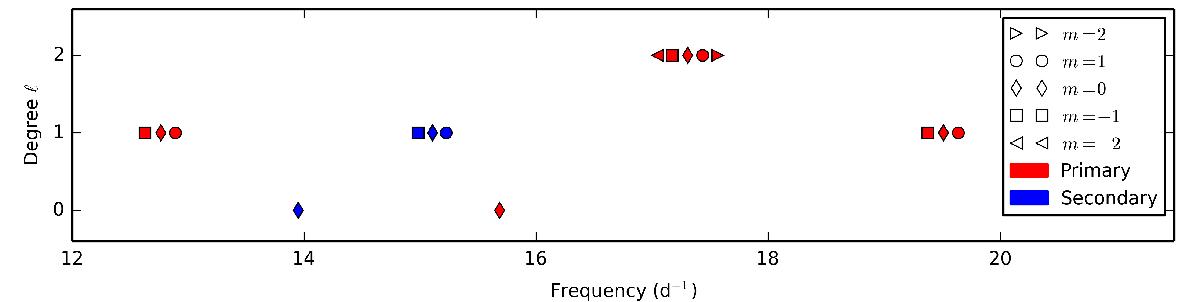
Observed p-mode frequencies as a function of degree ℓ, which was estimated, assuming that all observed multiplets are complete. Modes of the primary are shown in red and those of the secondary are shown in blue. The m values are distinguished by the different symbols.
Current usage metrics show cumulative count of Article Views (full-text article views including HTML views, PDF and ePub downloads, according to the available data) and Abstracts Views on Vision4Press platform.
Data correspond to usage on the plateform after 2015. The current usage metrics is available 48-96 hours after online publication and is updated daily on week days.
Initial download of the metrics may take a while.