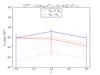
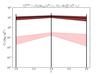
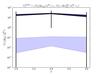
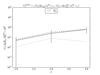
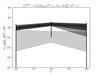
Fig. 4
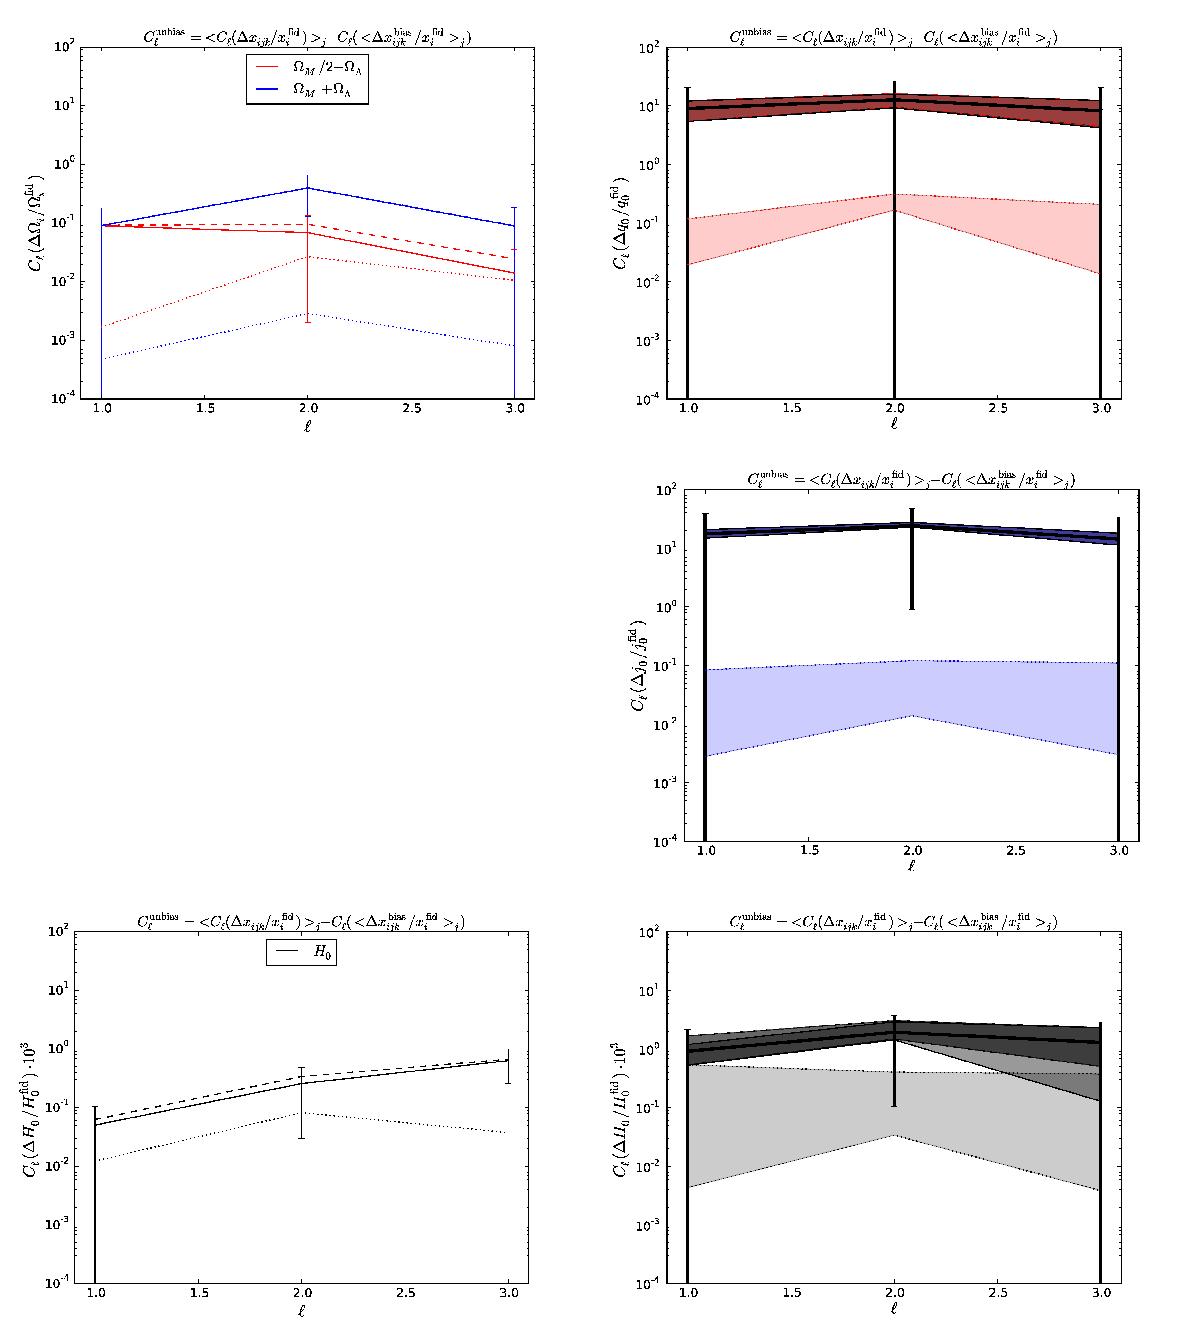
Power spectrum of the parameters estimated from the JLA type Ia SN sample (method A). The dashed lines are the mean power spectra from the “Cosmic variance” estimation, the dotted lines are the power spectra of the average “Shuffle SNe” estimation and the solid lines are the unbiased power spectra defined as the difference between the former two. Left panels: power spectra from the { H0,ΩM,ΩΛ } estimation. Right panels: power spectra from the { H0,q0,j0 } estimation.
Current usage metrics show cumulative count of Article Views (full-text article views including HTML views, PDF and ePub downloads, according to the available data) and Abstracts Views on Vision4Press platform.
Data correspond to usage on the plateform after 2015. The current usage metrics is available 48-96 hours after online publication and is updated daily on week days.
Initial download of the metrics may take a while.