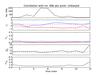
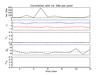
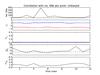
Fig. 3
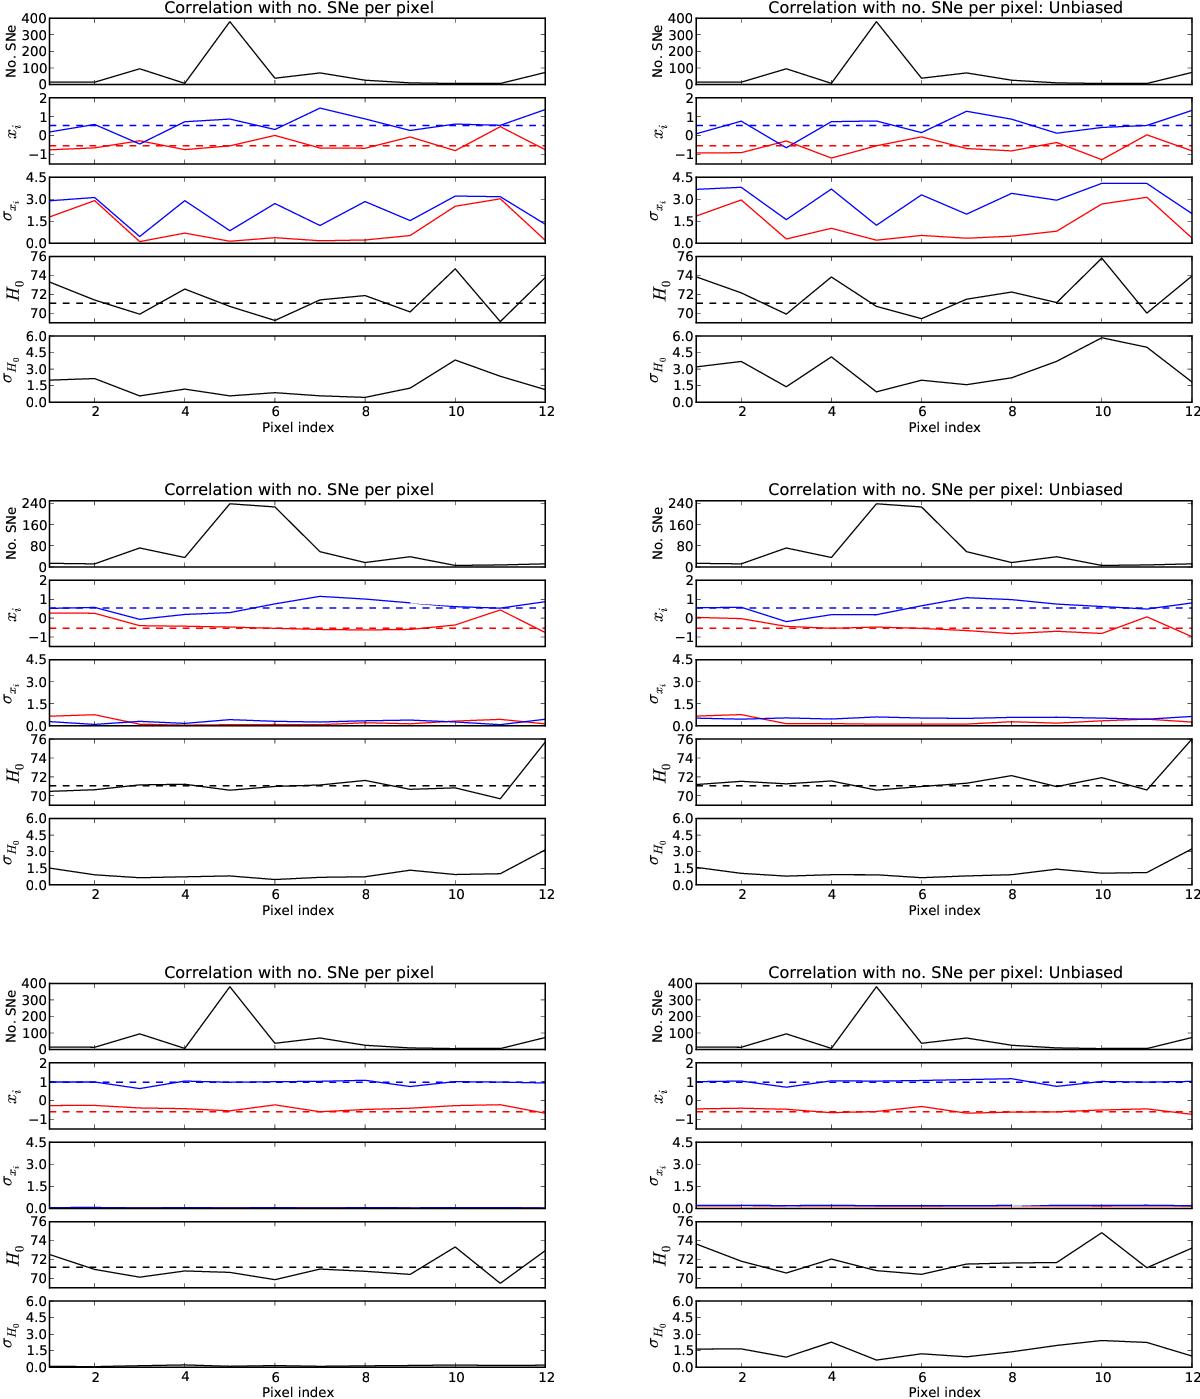
Fluctuations of the estimated parameters as a function of the number of SNe per pixel, before (left panel sets) and after (right panel sets) noise bias removal. Each panel set consists of five panels. At each pixel we plot: a) in the first panel, the number of SNe; b) in the second panel, the value of the parameters { q0,j0 } respectively as the solid red and solid blue lines, with the dashed red and dashed blue lines indicating the corresponding fiducial values; c) in the third panel, the standard deviation { σq0,σj0 } respectively as solid red and solid blue lines; d) in the fourth plot, the value of H0 as the solid black line, with the dashed black line marking the fiducial value; e) in the fifth panel, the standard deviation σH0 as the solid black line. Top panel sets: results from the { H0,q0,j0 } estimation for one pixelation. Centre panel sets: results from the { H0,q0,j0 } estimation for the average over the different pixelations. Bottom panel sets: results from the { H0,ΩM,ΩΛ } estimation for Ωκ = 1−ΩM−ΩΛ.
Current usage metrics show cumulative count of Article Views (full-text article views including HTML views, PDF and ePub downloads, according to the available data) and Abstracts Views on Vision4Press platform.
Data correspond to usage on the plateform after 2015. The current usage metrics is available 48-96 hours after online publication and is updated daily on week days.
Initial download of the metrics may take a while.