Fig. 4
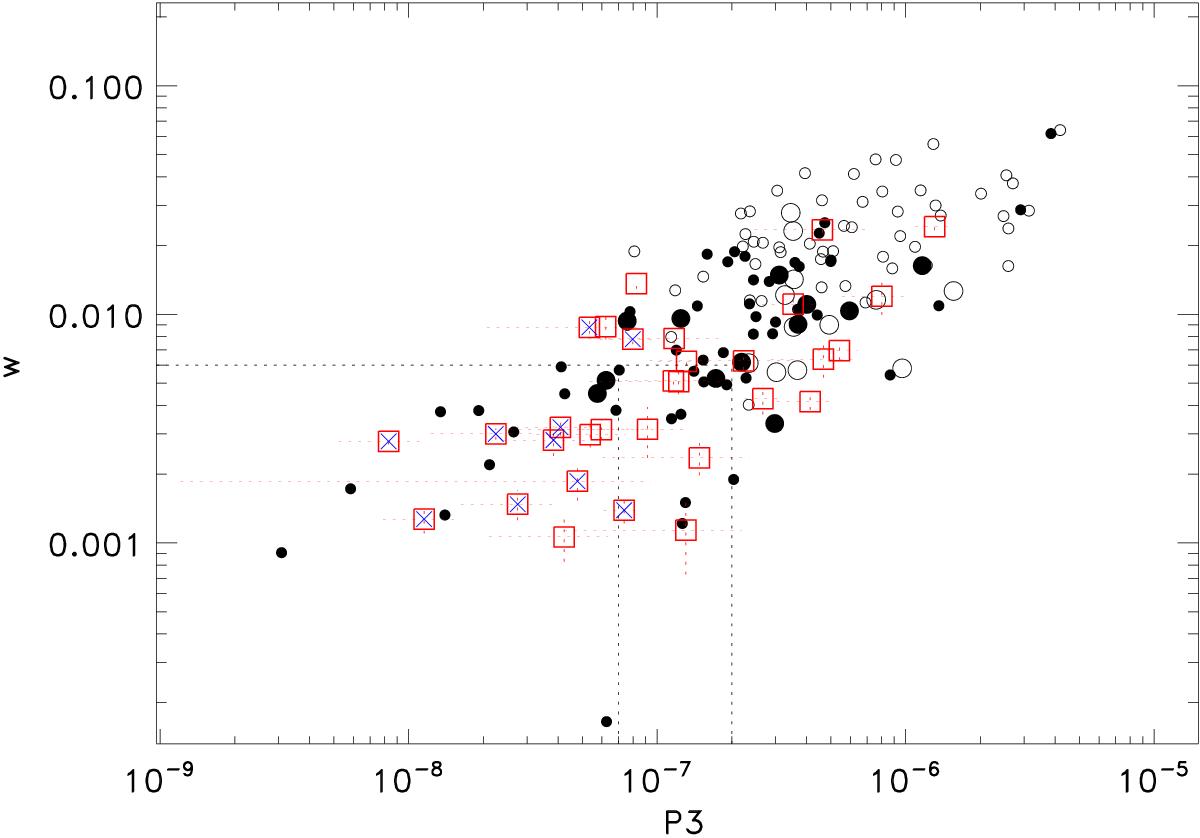
Comparison of the centre shift parameter w and power ratio P3 for observations (red squares) and simulations (circles). Open circles indicate clusters with and filled circles without AGN feedback. The massive clusters are marked with larger circles. Among the observations cool-core clusters are indicated with blue crosses. Dotted lines give guidelines to distinguish different morphological types (see text for details).
Current usage metrics show cumulative count of Article Views (full-text article views including HTML views, PDF and ePub downloads, according to the available data) and Abstracts Views on Vision4Press platform.
Data correspond to usage on the plateform after 2015. The current usage metrics is available 48-96 hours after online publication and is updated daily on week days.
Initial download of the metrics may take a while.