Fig. 3
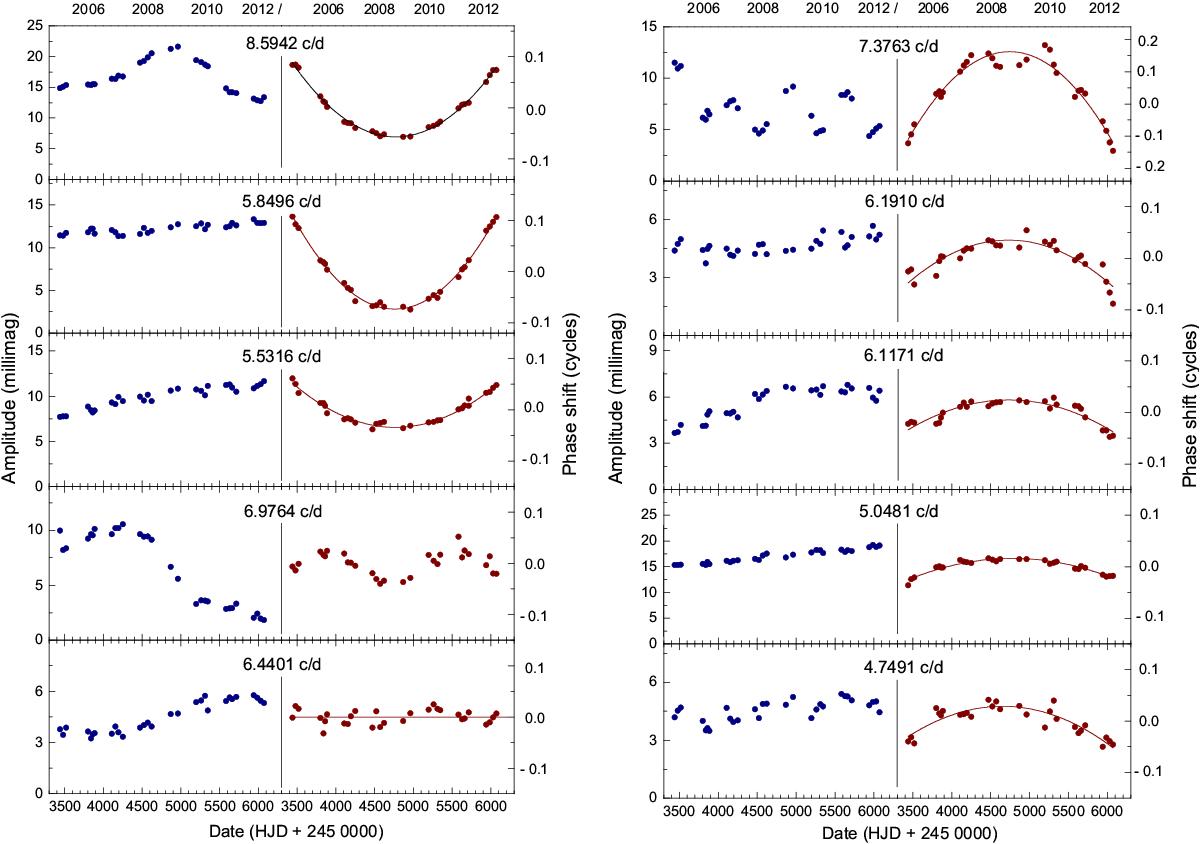
(O−C) phase shifts and amplitude variations in the y passband of 10 dominant modes from 2005 to 2012. For each mode, the phase shifts (indicating frequency variations) were determined from an average frequency. The formal uncertainties are generally of the size of the plotted dots and therefore not shown. The solid lines represent least-squares fits of constant frequency changes. The excellent fits for most modes indicate constant frequency (period) changes, suggesting a timescale of at least decades.
Current usage metrics show cumulative count of Article Views (full-text article views including HTML views, PDF and ePub downloads, according to the available data) and Abstracts Views on Vision4Press platform.
Data correspond to usage on the plateform after 2015. The current usage metrics is available 48-96 hours after online publication and is updated daily on week days.
Initial download of the metrics may take a while.