Fig. 2
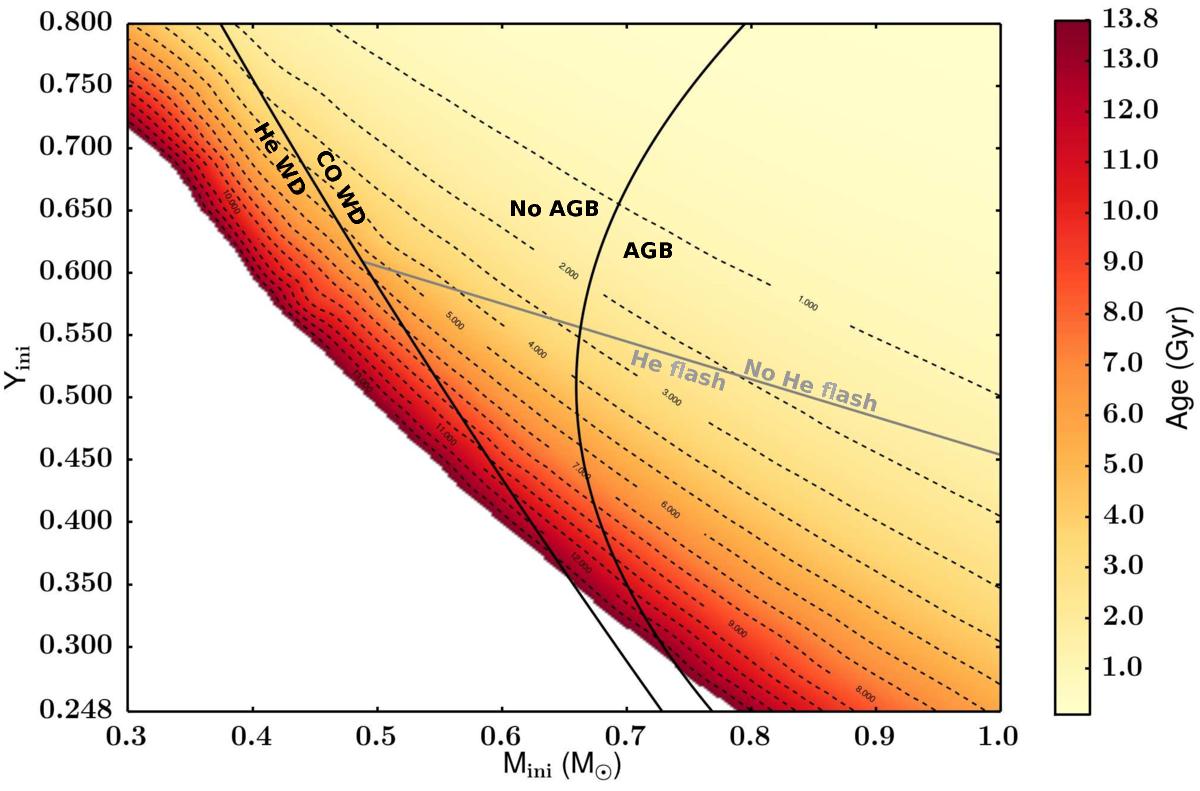
Diagram representing the age of the stars at the turnoff (color-coded) as a function of the initial helium mass fraction and mass for the grid of 330 models (Z = 5.4 × 10⁻⁴). The dashed lines link the stellar models reaching the turnoff at a given age (numbers, in Gyr), and the white area corresponds to turnoff ages later than 13.8 Gyr. The thick black lines separate the different behaviors of the models; the left line delimits the domains where stars become either He or CO white dwarfs, and the right line separates the stars that climb the AGB from those that do not. The gray line delimits the domain where helium ignition (when it occurs) starts with a flash or in non-degenerate conditions.
Current usage metrics show cumulative count of Article Views (full-text article views including HTML views, PDF and ePub downloads, according to the available data) and Abstracts Views on Vision4Press platform.
Data correspond to usage on the plateform after 2015. The current usage metrics is available 48-96 hours after online publication and is updated daily on week days.
Initial download of the metrics may take a while.