Free Access
Fig. 5
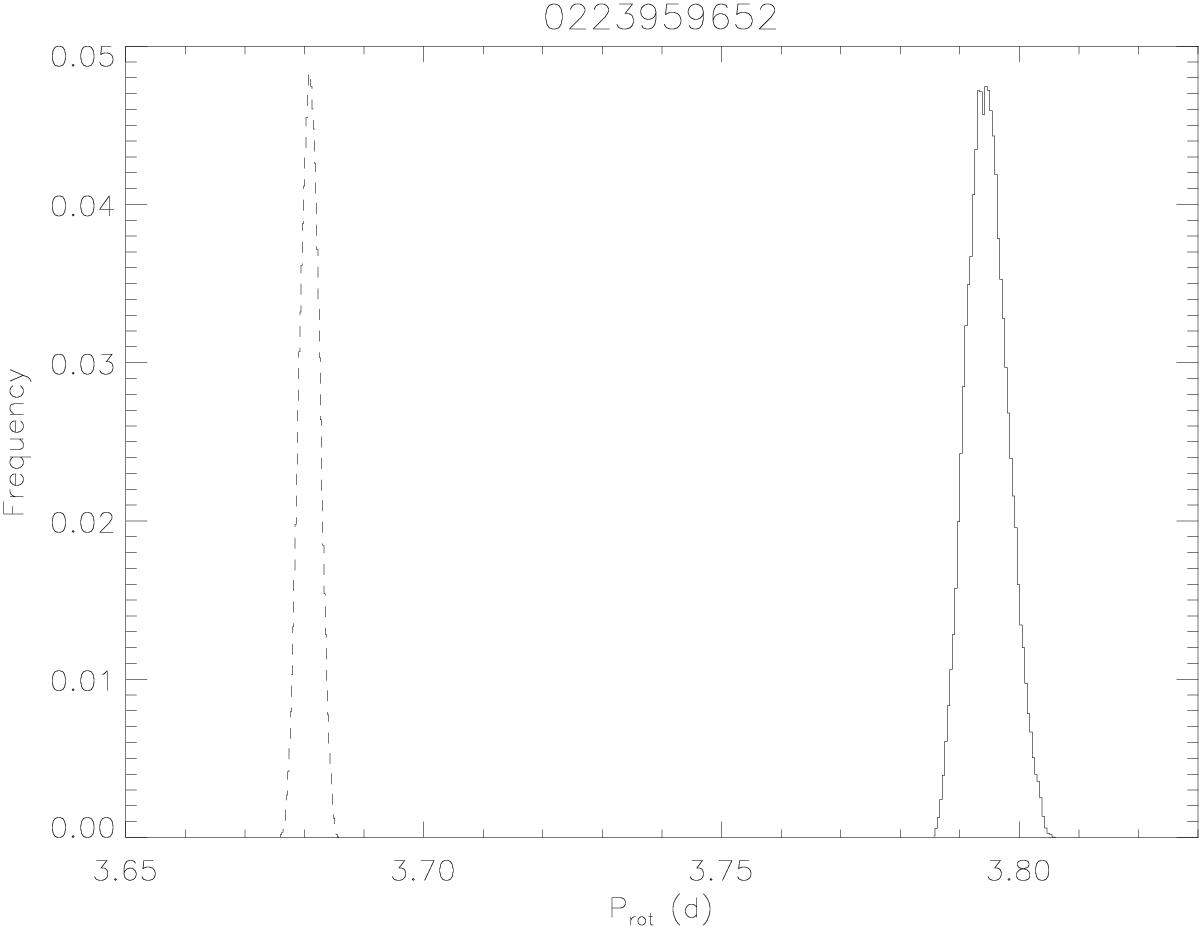
A posteriori marginal distributions of the rotation periods of the two spots as derived from the MCMC analysis for CoRoT 223959652. The solid line refers to the distribution of the rotation period of the first spot, the dashed line to that of the second.
Current usage metrics show cumulative count of Article Views (full-text article views including HTML views, PDF and ePub downloads, according to the available data) and Abstracts Views on Vision4Press platform.
Data correspond to usage on the plateform after 2015. The current usage metrics is available 48-96 hours after online publication and is updated daily on week days.
Initial download of the metrics may take a while.