Fig. 11
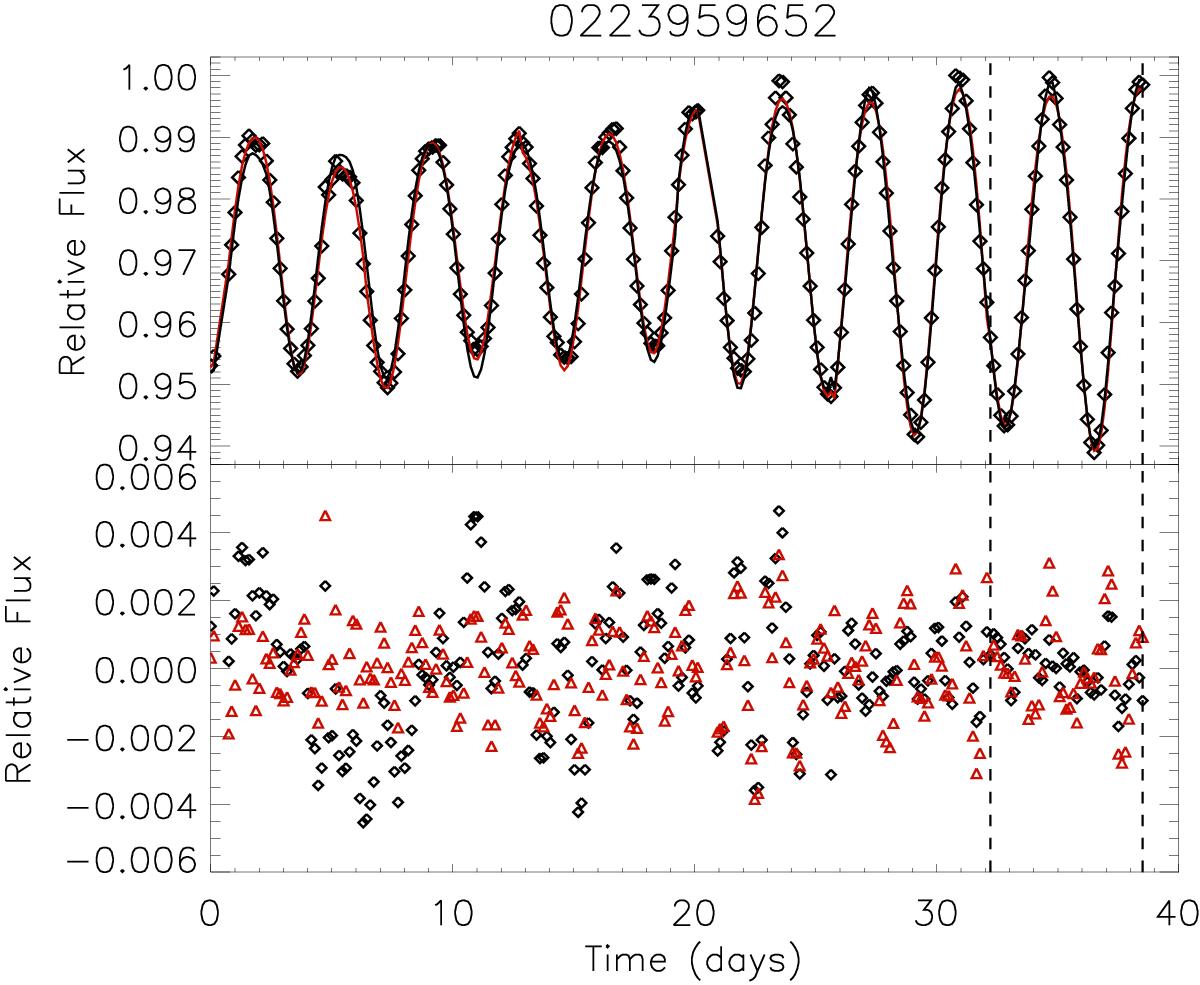
Upper panel: entire light curve of CoRoT 223959652 (open diamonds) together with the best fits obtained by fitting individual intervals of the same length as that used to search for differential rotation (indicated by the dashed vertical lines) with the two-spot model (black solid line) and the evolving single-spot model (red solid line). Lower panel: residuals of the two best fit models; those of the two-spot model are plotted as black diamonds, while those of the evolving single-spot model as red triangles.
Current usage metrics show cumulative count of Article Views (full-text article views including HTML views, PDF and ePub downloads, according to the available data) and Abstracts Views on Vision4Press platform.
Data correspond to usage on the plateform after 2015. The current usage metrics is available 48-96 hours after online publication and is updated daily on week days.
Initial download of the metrics may take a while.