Fig. 1
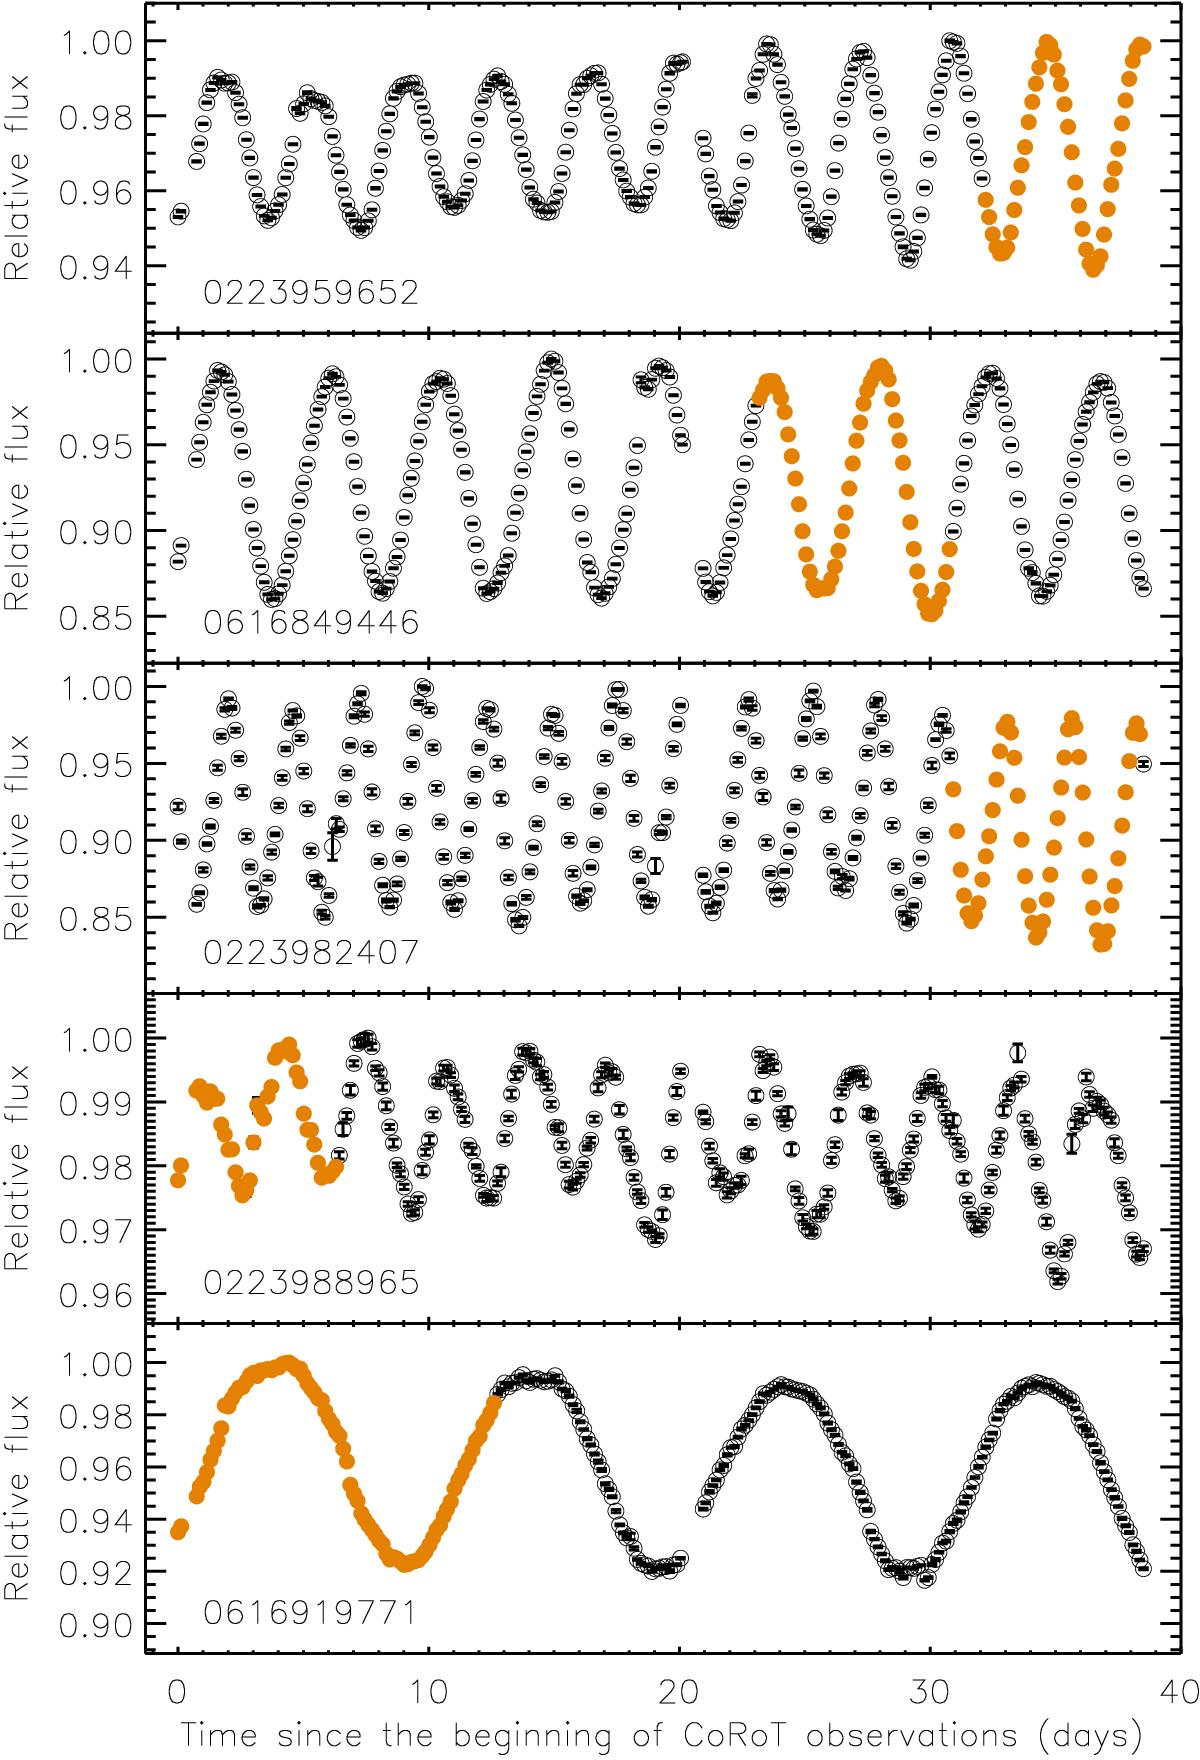
Light curves of our five target stars displaying the flux normalized to the respective maximum value vs. the time as labelled. Errorbars are within the size of the symbols and indicate the standard error of each point that is an average of individual CoRoT measurements along two consecutive satellite orbits (open black circles). Filled orange circles indicate the segment of the light curve fitted to find the spot rotation periods (see Sect. 3).
Current usage metrics show cumulative count of Article Views (full-text article views including HTML views, PDF and ePub downloads, according to the available data) and Abstracts Views on Vision4Press platform.
Data correspond to usage on the plateform after 2015. The current usage metrics is available 48-96 hours after online publication and is updated daily on week days.
Initial download of the metrics may take a while.