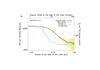
Fig. A.1
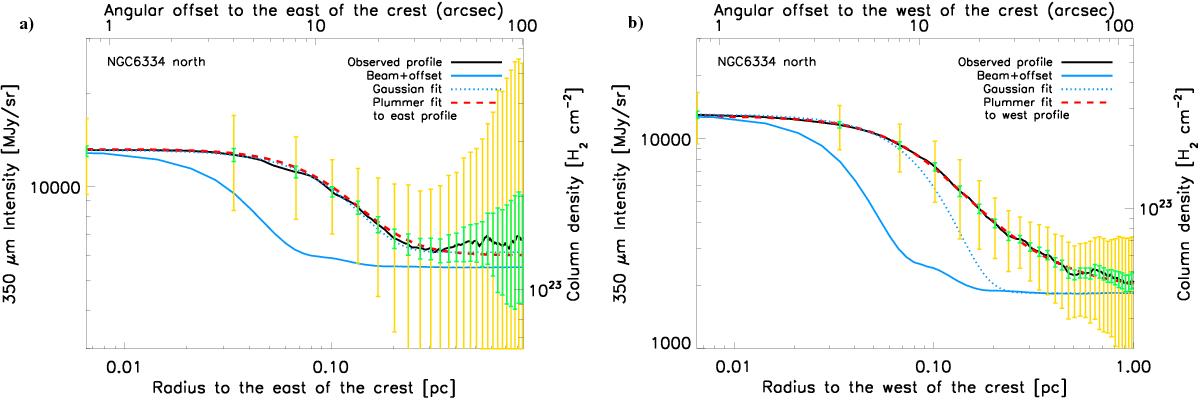
a) Median radial intensity profile of the northern part of the NGC 6334 filament (black solid curve) measured in the combined ArTéMiS + SPIRE 350 μm image (Fig. 1b) perpendicular to, and on the eastern side of, the filament crest shown as a white curve in Fig. 2a. The yellow and green error bars are as in Fig. 3a. The blue solid curve shows the effective beam profile of the ArTéMiS 350 μm data as measured on Mars, overlaid on a constant level corresponding to the typical background intensity level observed at large radii. The blue dotted curve shows the best-fit Gaussian (+ constant offset) model to the inner part of the observed profile. The red dashed curve shows the best-fit Plummer model convolved with the beam (cf. Sect. 3 and Eq. (2)). b) Same as in a) but for the median radial intensity profile of the northern part of the filament measured on the western side of the filament crest shown as a white curve in Fig. 2a.
Current usage metrics show cumulative count of Article Views (full-text article views including HTML views, PDF and ePub downloads, according to the available data) and Abstracts Views on Vision4Press platform.
Data correspond to usage on the plateform after 2015. The current usage metrics is available 48-96 hours after online publication and is updated daily on week days.
Initial download of the metrics may take a while.