Fig. 3
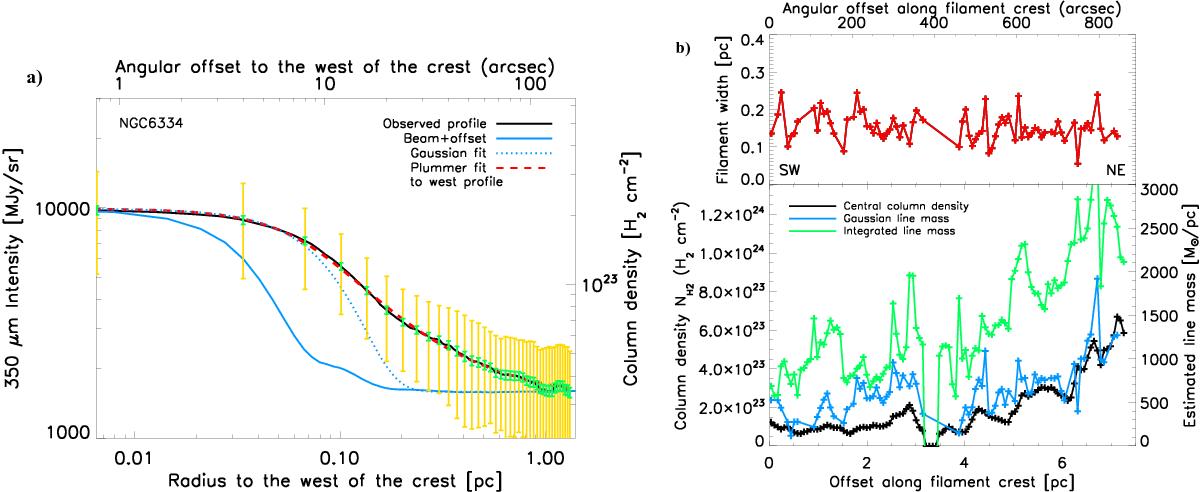
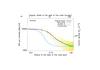
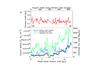
a) Median radial intensity profile of the NGC 6334 filament (black solid curve) measured perpendicular to, and on the western side of, the filament crest shown as a magenta curve in Fig. 1b. The yellow error bars visualize the (± 1σ) dispersion of the distribution of radial intensity profiles observed along the filament crest, while the smaller green error bars represent the standard deviation of the mean intensity profile (the data points and error bars are spaced by half a beam width). The blue solid curve shows the effective beam profile of the ArTéMiS 350 μm data as measured on Mars, overlaid on a constant level corresponding to the typical background intensity level observed at large radii. The blue dotted curve shows the best-fit Gaussian (+ constant offset) model to the inner part of the observed profile. The red dashed curve shows the best-fit Plummer model convolved with the beam as described in the text. b) Upper panel: deconvolved Gaussian FWHM width of the NGC 6334 filament as a function of position along the filament crest (from southwest to northeast), with one width measurement per independent ArTéMiS beam of 8″ (red crosses). Lower panel: observed column density (black curve and left y-axis), background-subtracted mass per unit length (blue curve and right y-axis) derived from a Gaussian fit (cf. blue dotted curve in a)) to the filament transverse profile, and background-subtracted mass per unit length (green curve and right y-axis) derived from integration of the observed transverse profile (cf. black curve in a)) up to an outer radius of 0.7 pc (or ~ 80″) where the background starts to dominate, all plotted as a function of position along the filament crest.
Current usage metrics show cumulative count of Article Views (full-text article views including HTML views, PDF and ePub downloads, according to the available data) and Abstracts Views on Vision4Press platform.
Data correspond to usage on the plateform after 2015. The current usage metrics is available 48-96 hours after online publication and is updated daily on week days.
Initial download of the metrics may take a while.