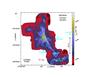
Fig. 2

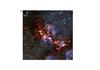
a) Approximate H2 column density map of the central part of the NGC 6334 star-forming complex derived from the combined ArTéMiS + SPIRE 350 μm image shown in Fig. 1b, assuming optically thin dust emission at the temperature given by the Herschel/HOBYS dust temperature map of Tigé et al. (2016; see also Russeil et al. 2013). The effective angular resolution is 8″ (HPBW). The crest of the northern part of the NGC 6334 main filament as traced by the DisPerSE algorithm (Sousbie 2011) is marked by the white curve, while the crest of the southern part is shown by the magenta curve. Black crosses and roman numerals (I, V) denote bright far-infrared sources (Kraemer & Jackson 1999). Cyan open circles mark two candidate starless “massive dense cores” from Tigé et al. (2016). Cyan open diamonds and alphabetical letters A–E indicate compact HII regions detected in the 6 cm radio continuum with the VLA (Rodriguez et al. 1982), and cyan filled triangles mark diffuse HII regions traced as diffuse Hα emission nebulosities (Gum 1955). b) ArTéMiS 350 μm image (orange) overlaid on a view of the same region taken at near-infrared wavelengths with the ESO VISTA telescope (see ESO photo release http://www.eso.org/public/images/eso1341a/ – Credit: ArTéMiS team/ESO/J. Emerson/VISTA).
Current usage metrics show cumulative count of Article Views (full-text article views including HTML views, PDF and ePub downloads, according to the available data) and Abstracts Views on Vision4Press platform.
Data correspond to usage on the plateform after 2015. The current usage metrics is available 48-96 hours after online publication and is updated daily on week days.
Initial download of the metrics may take a while.