Fig. 8
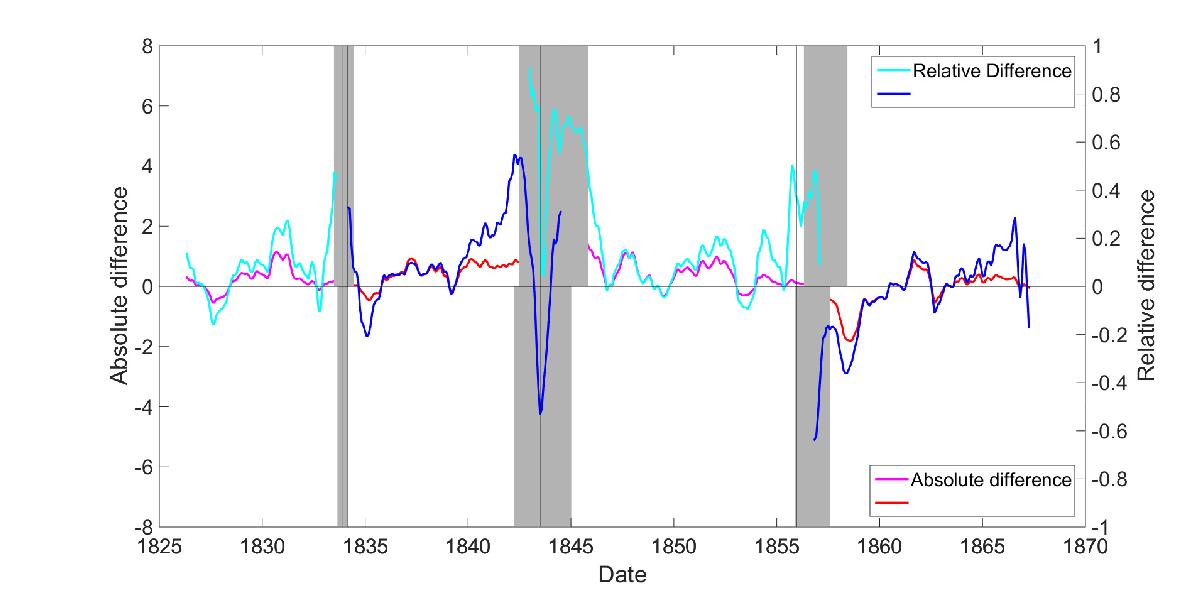
Relative difference (cyan for cycles 7 and 9, and blue for cycles 8 and 10) and absolute difference (magenta for cycles 7 and 9 and red for cycles 8 and 10) between the GF-smoothed GSN-S in the northern wing (GSN-SN) and the southern wing (GSN-SS). Vertical lines denote times of minima based on Table 2. Grey areas denote wing overlap times.
Current usage metrics show cumulative count of Article Views (full-text article views including HTML views, PDF and ePub downloads, according to the available data) and Abstracts Views on Vision4Press platform.
Data correspond to usage on the plateform after 2015. The current usage metrics is available 48-96 hours after online publication and is updated daily on week days.
Initial download of the metrics may take a while.