Fig. 4
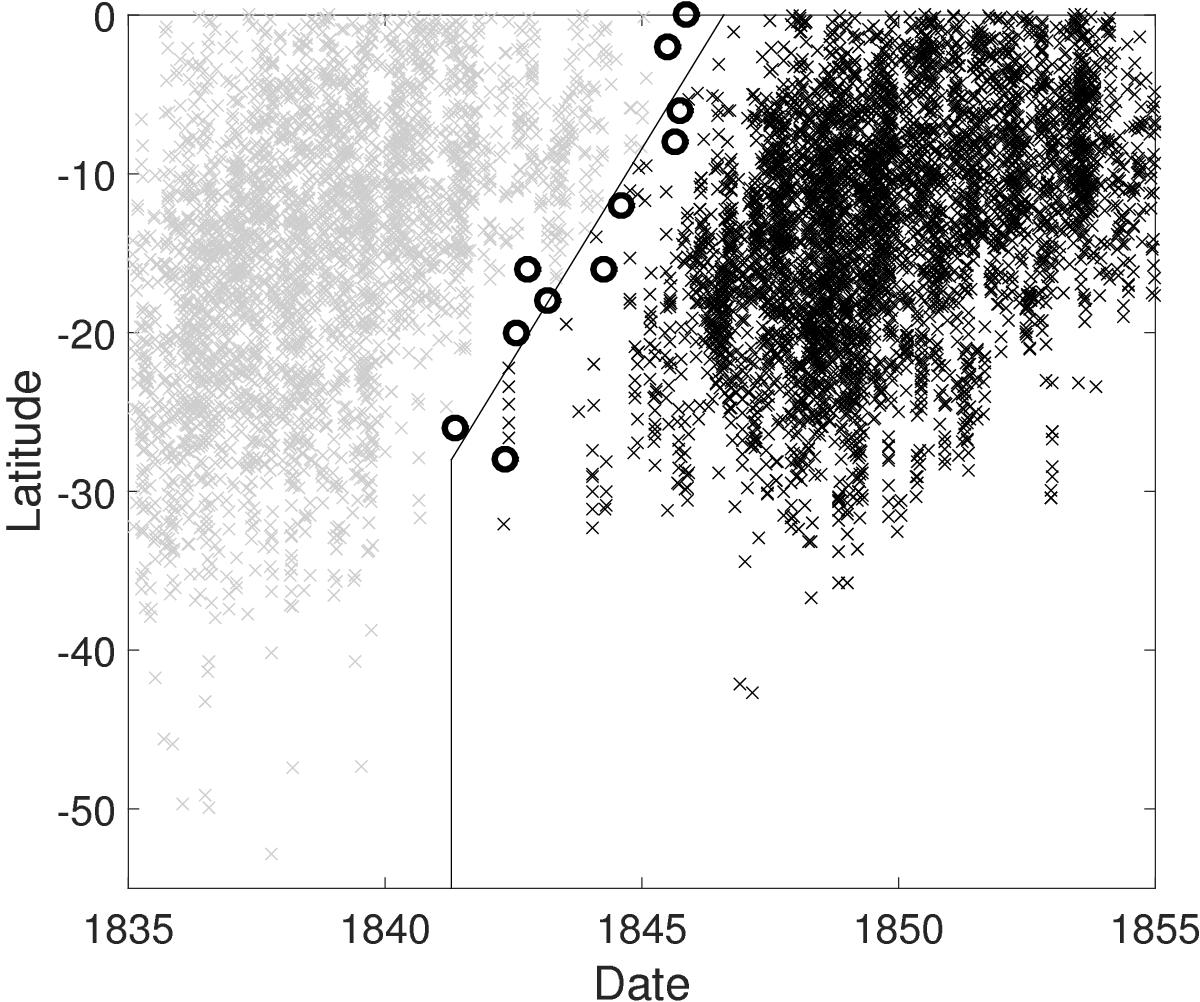
A fragment of the butterfly diagram around the gap between the southern wings of cycles 8 and 9. Sunspot groups belonging to cycle 8 are plotted in grey and cycle 9 groups in black. The centres of all the detected gaps longer than the threshold gap length of Table 4 are plotted in black circles. The fitted line up to −28° and the vertical line poleward of −28° between the wings are plotted in black.
Current usage metrics show cumulative count of Article Views (full-text article views including HTML views, PDF and ePub downloads, according to the available data) and Abstracts Views on Vision4Press platform.
Data correspond to usage on the plateform after 2015. The current usage metrics is available 48-96 hours after online publication and is updated daily on week days.
Initial download of the metrics may take a while.