Free Access
Fig. 4
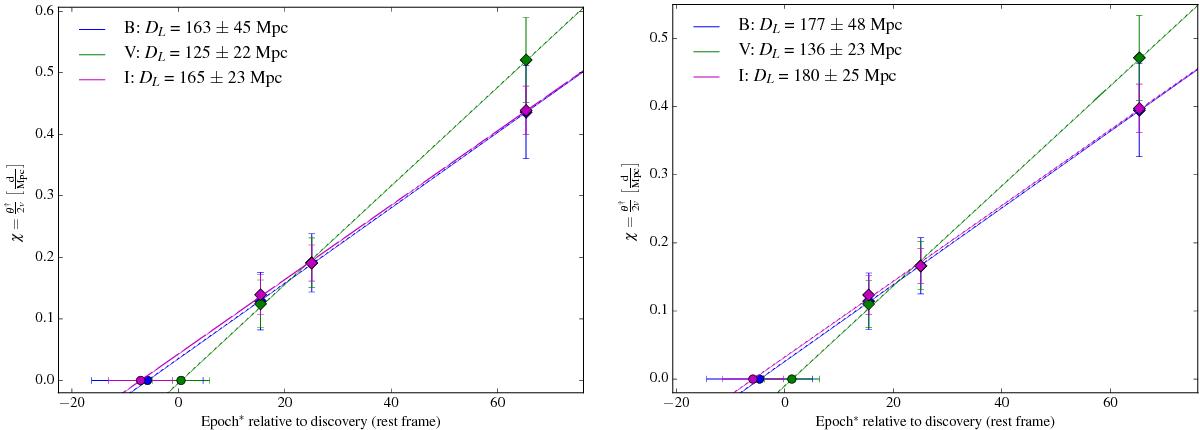
Distance fit for SN 2013eq using ζBVI as given in Hamuy et al. (2001; left panel) and Dessart & Hillier (2005; right panel). The diamond markers denote values of χ through which the fit is made; circle markers depict the resulting epoch of explosion.
This figure is made of several images, please see below:
Current usage metrics show cumulative count of Article Views (full-text article views including HTML views, PDF and ePub downloads, according to the available data) and Abstracts Views on Vision4Press platform.
Data correspond to usage on the plateform after 2015. The current usage metrics is available 48-96 hours after online publication and is updated daily on week days.
Initial download of the metrics may take a while.