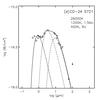
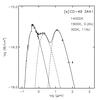
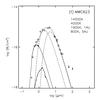
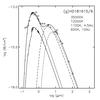
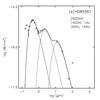
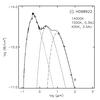
Fig. 3
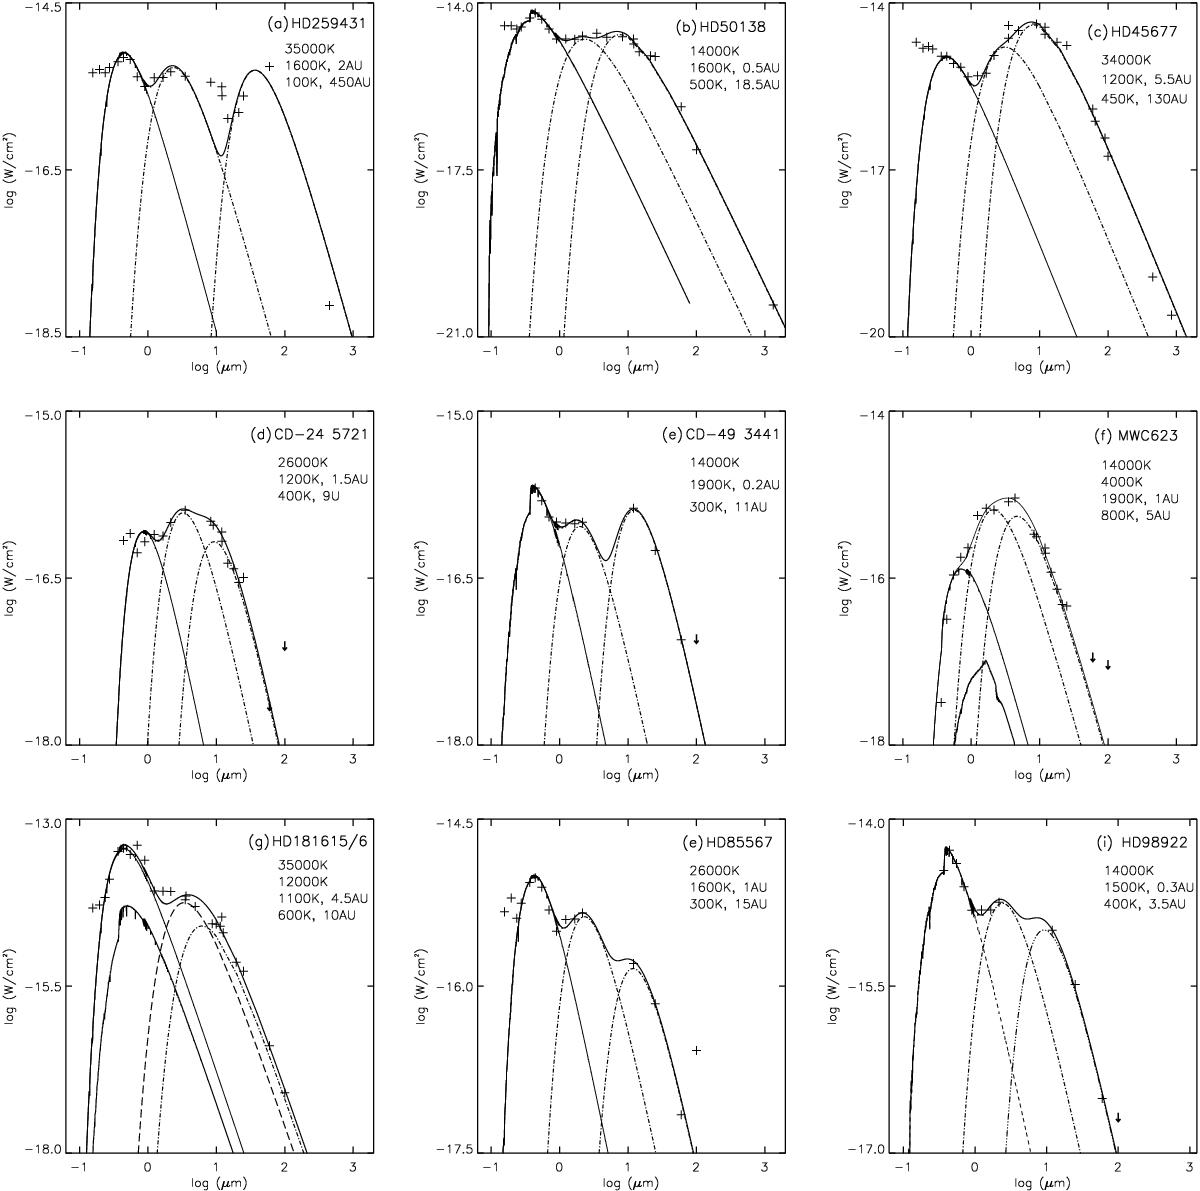
SEDs of B[e] stars showing large near-infrared excess emission. a) The Herbig star HD 259431 has a prominent excess emission not only in near-infrared, but also in far-infrared wavelengths. b)–i) The sample of B[e] stars with reduced excess emission in far-infrared and submillimeter. Overlaid for each star are a model stellar photosphere (Kurucz 1993) (solid line), two blackbody curves to present the inner and outer edges of the envelope (dash-dotted lines), and the sum of the three (top solid line). Photometric data sources are summarized in Tables 1 and 2. Additional data include those in a)Mannings (1994, 450 μ; b) 1.3 mm measurement (this work); in c) AKARI/IRC mid-infrared all-sky survey and AKARI/FIS all-sky survey point source catalogs (Yamamura et al. 2010; Ishihara et al. 2010; 9, 18, 65 and 90 μm), COBE DIRBE point source catalog (Smith et al. 2004; 3.5, 4.9 and 12 μm) and (Di Francesco et al. 2008; 450 and 850 μm), and in g) (Gehrz et al. 1974; 2.3, 3.6, 4.9, 8.7, 10, 11.4, 12.6 and 19.5 μm).
Current usage metrics show cumulative count of Article Views (full-text article views including HTML views, PDF and ePub downloads, according to the available data) and Abstracts Views on Vision4Press platform.
Data correspond to usage on the plateform after 2015. The current usage metrics is available 48-96 hours after online publication and is updated daily on week days.
Initial download of the metrics may take a while.