Fig. 1
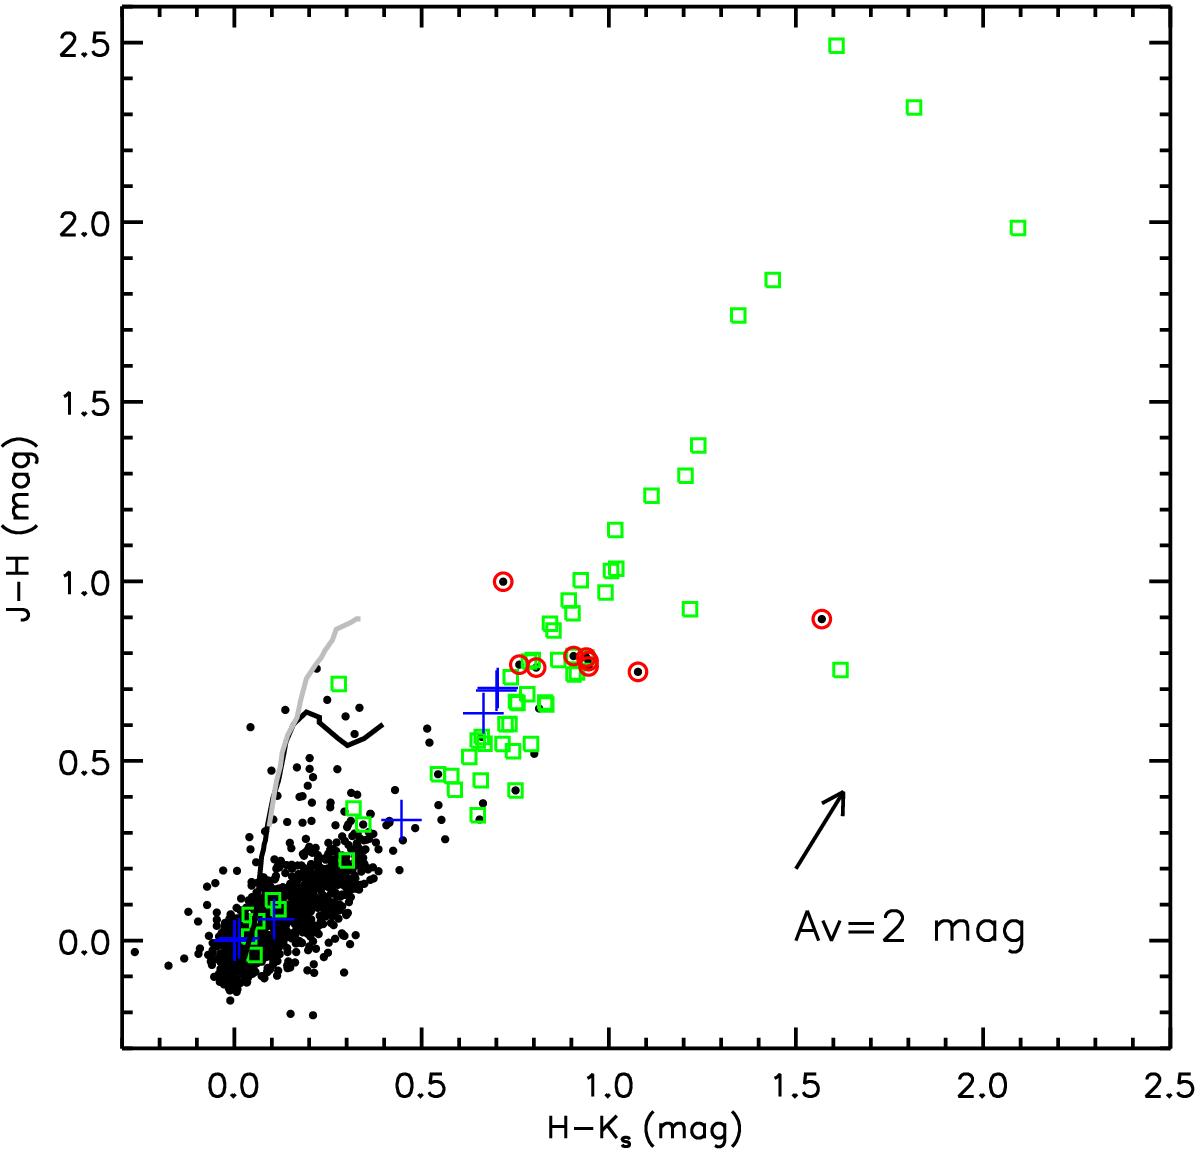
2MASS J−H versus H−Ks diagram showing most Be stars (black dots) distinctly separated from Herbig stars (squares), except a few Be stars with very large near-infrared excess (open circles). The sample of Be stars is taken from Zhang et al. (2005), and that of Herbig stars is from de Winter et al. (2001). The crosses indicate the levels of the free-free emission with varying electron number densities and emitting volumes. From bottom left, each cross represents an increase of an order, from 100 to 108 times in emissivity (see text) surrounding a B0 V star with a gas temperature of 20 000 K. The first three crosses (100 to 102 times) and the last two crosses (107 to 108 times), are, respectively, almost overlapped. The gray and black curves are giant and dwarf loci (Bessell & Brett 1988) converted to the 2MASS system. The arrow shows the reddening vector (Rieke & Lebofsky 1985) for an average Galactic total-to-selective extinction (R = 3.1).
Current usage metrics show cumulative count of Article Views (full-text article views including HTML views, PDF and ePub downloads, according to the available data) and Abstracts Views on Vision4Press platform.
Data correspond to usage on the plateform after 2015. The current usage metrics is available 48-96 hours after online publication and is updated daily on week days.
Initial download of the metrics may take a while.