Fig. 2
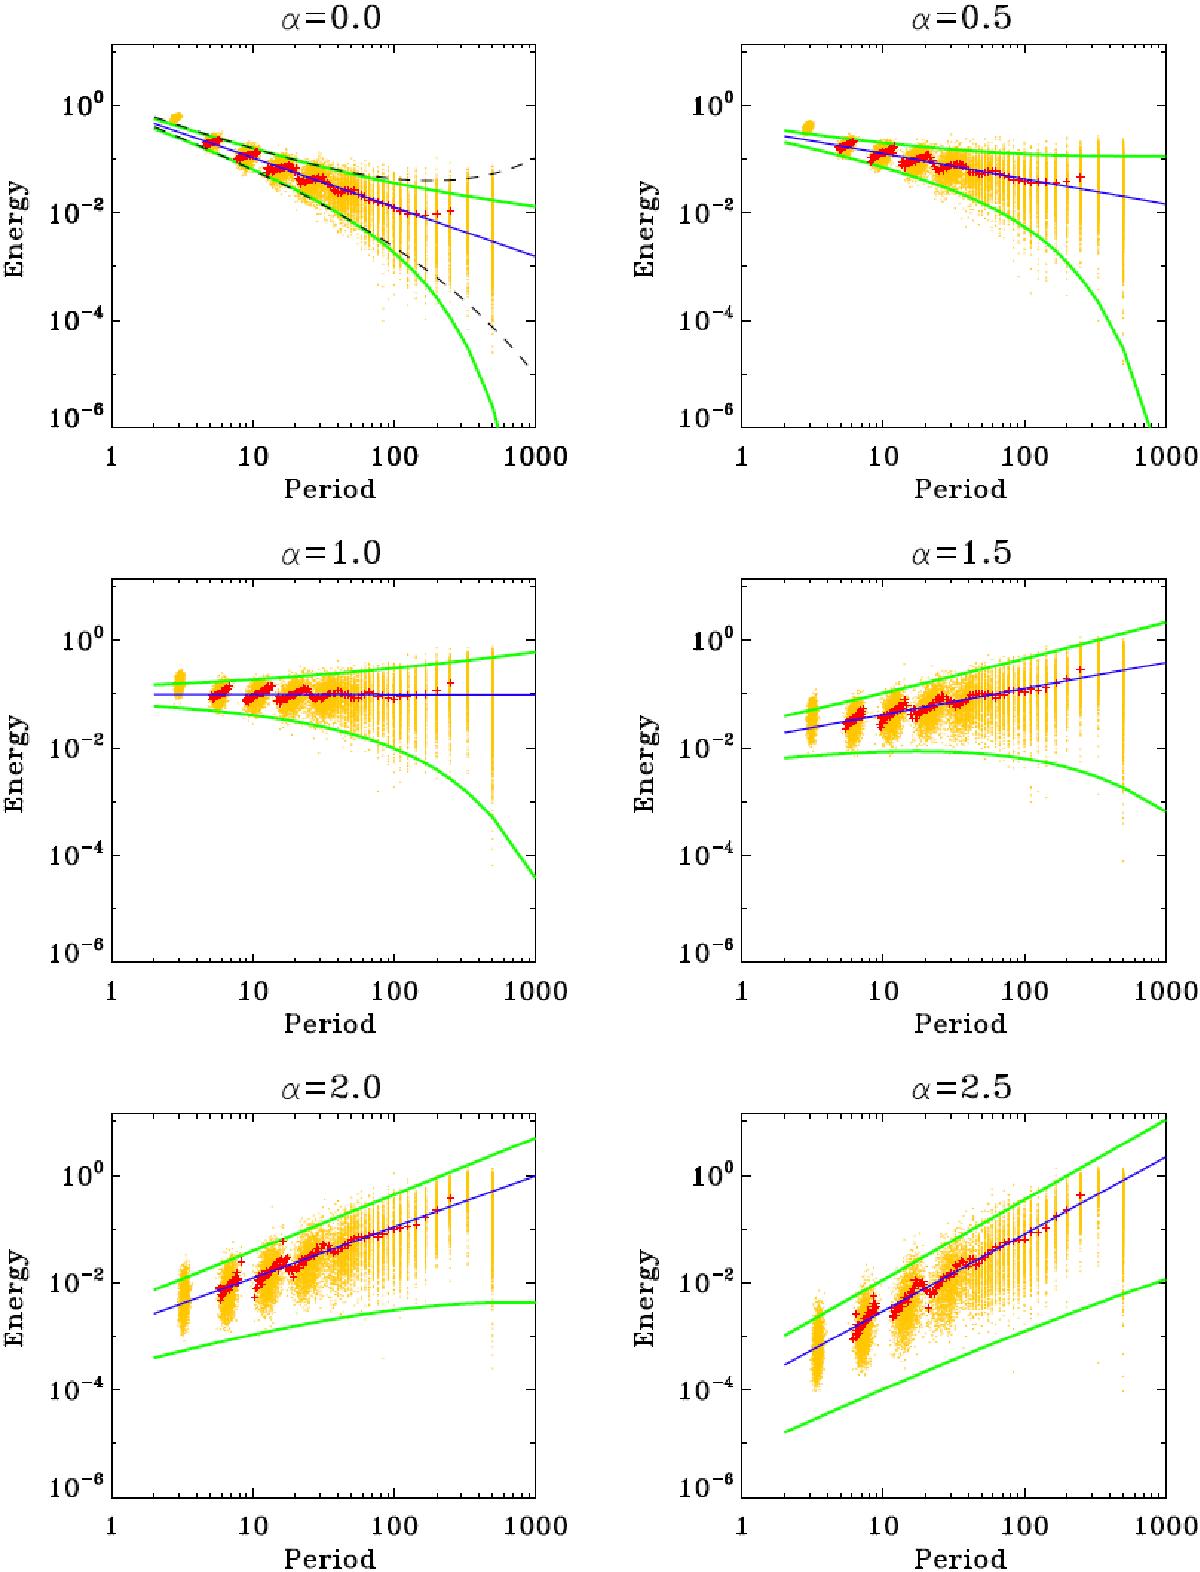
Energy-period distributions (yellow dots) of IMFs obtained with EMD from 2000 independent samples of synthetic noisy signals with α = 0 (the white noise), α = 0.5, α = 1 (flicker or the pink noise), α = 1.5, α = 2 (Brown(ian) or the red noise), and α = 2.5. Each sample contains 500 data points. All samples were normalised for their total energy to be unity. Period is measured in dimensionless evenly sampled time-steps between the data points. The energy averaged over each period is indicated by the red crosses. Blue lines represent the empirical dependence of the mean modal energy ![]() upon the period P, obtained with the linear fitting. Green lines show E±(P) functions, the 99% and 1% confidence intervals, calculated for the chi-squared distribution given by Eq. (5). For the white noise (α = 0), the 99% confidence interval from Wu & Huang (2004), obtained as the second-order Taylor expansion of the exact dependence, is shown with the dashed lines.
upon the period P, obtained with the linear fitting. Green lines show E±(P) functions, the 99% and 1% confidence intervals, calculated for the chi-squared distribution given by Eq. (5). For the white noise (α = 0), the 99% confidence interval from Wu & Huang (2004), obtained as the second-order Taylor expansion of the exact dependence, is shown with the dashed lines.
Current usage metrics show cumulative count of Article Views (full-text article views including HTML views, PDF and ePub downloads, according to the available data) and Abstracts Views on Vision4Press platform.
Data correspond to usage on the plateform after 2015. The current usage metrics is available 48-96 hours after online publication and is updated daily on week days.
Initial download of the metrics may take a while.