Fig. 8
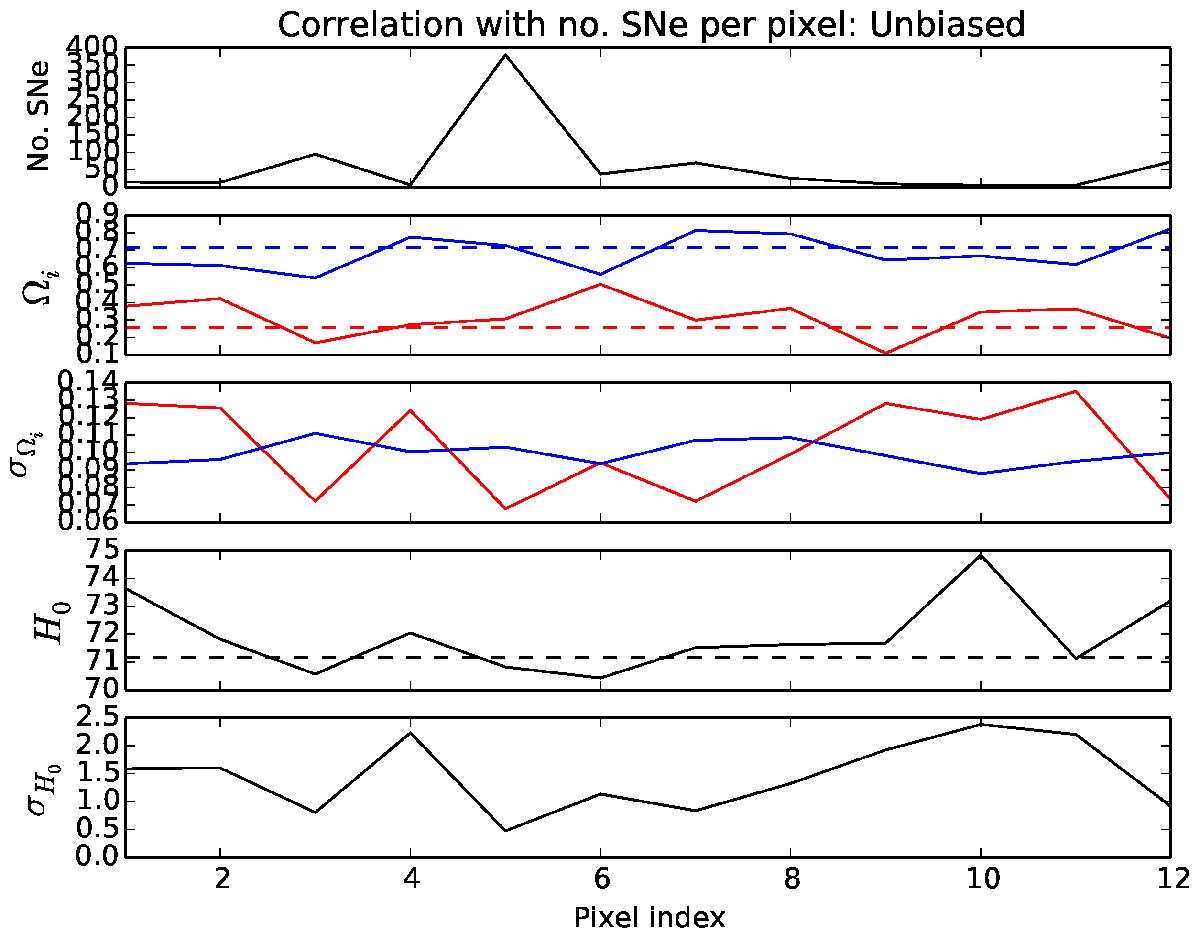
Correlation of the number of SNe per pixel with the estimated parameter fluctuations about the fiducial values after the noise bias removal. At each pixel we plot a) in the first panel, the number of SNe; b) in the second panel, the value of the parameters { ΩM,ΩΛ } as solid red and solid blue lines, respectively, with the dashed red and dashed blue lines representing the corresponding fiducial values; c) in the third panel, the standard deviation { σΩM,σΩΛ } as solid red and solid blue lines, respectively; d) in the fourth plot, the value of H0 as a solid black line, with the dashed black line representing the corresponding fiducial value; e) in the fifth panel, the standard deviation σH0 as a solid black line.
Current usage metrics show cumulative count of Article Views (full-text article views including HTML views, PDF and ePub downloads, according to the available data) and Abstracts Views on Vision4Press platform.
Data correspond to usage on the plateform after 2015. The current usage metrics is available 48-96 hours after online publication and is updated daily on week days.
Initial download of the metrics may take a while.