Fig. 3
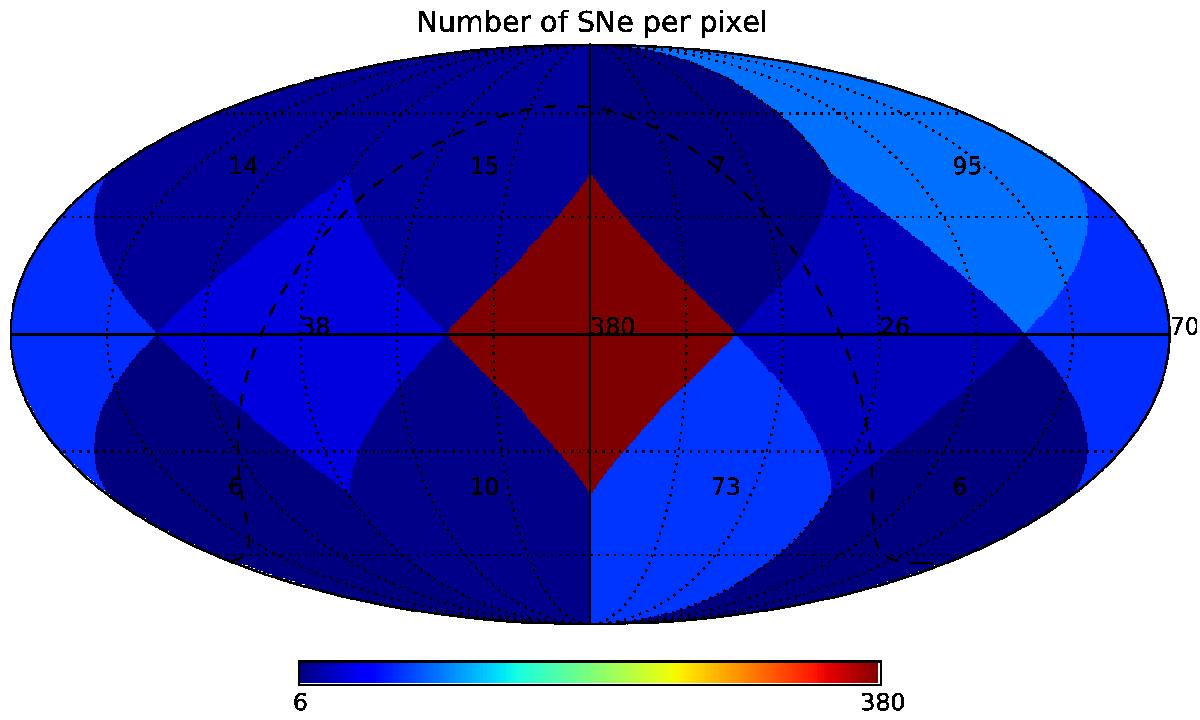
Angular distribution of the number of type Ia SNe per pixel. The total SN sample is divided into subsamples grouped by pixels in the HEALPix pixelation scheme. The number of SNe in each pixel is printed in the centre of the pixel. The pixel indices { 1, 2, 3, 4, 5, 6, 7, 8, 9, 10, 11, 12 } correspond to the SN counts { 15, 14, 95, 7, 380, 38, 70, 26, 10, 6, 6, 73 } . The dashed line represents the Galactic equator.
Current usage metrics show cumulative count of Article Views (full-text article views including HTML views, PDF and ePub downloads, according to the available data) and Abstracts Views on Vision4Press platform.
Data correspond to usage on the plateform after 2015. The current usage metrics is available 48-96 hours after online publication and is updated daily on week days.
Initial download of the metrics may take a while.