Fig. 2
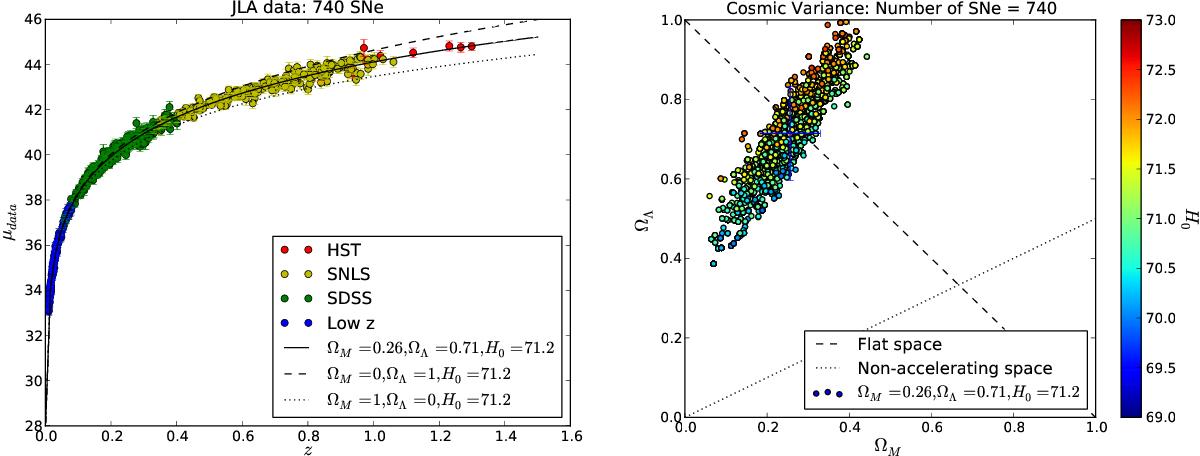
Left panel: distance modulus as a function of redshift. The dots are coloured according to the SN survey and indicate the distance modulus μdata computed from the data on each SN in the sample. The black line indicates the distance modulus μtheo computed theoretically for the values of { ΩM,ΩΛ,H0 } estimated from the complete sample. The black dashed and black dotted lines indicate the distance modulus for two extreme cases: ΩM = 0,ΩΛ = 1 and ΩM = 1,ΩΛ = 0, respectively. Right panel: Markov chain of one realization. The dots indicate the entries in the Markov chain. The position in the graph indicates the values of (ΩM,ΩΛ) of each entry according to the axes, whereas the coloured dots indicate the value of H0 according to the side colour bar. The dashed line represents ΩM + ΩΛ = 1 and the dotted line represents ΩM/ 2−ΩΛ = 0.
Current usage metrics show cumulative count of Article Views (full-text article views including HTML views, PDF and ePub downloads, according to the available data) and Abstracts Views on Vision4Press platform.
Data correspond to usage on the plateform after 2015. The current usage metrics is available 48-96 hours after online publication and is updated daily on week days.
Initial download of the metrics may take a while.