Fig. 7
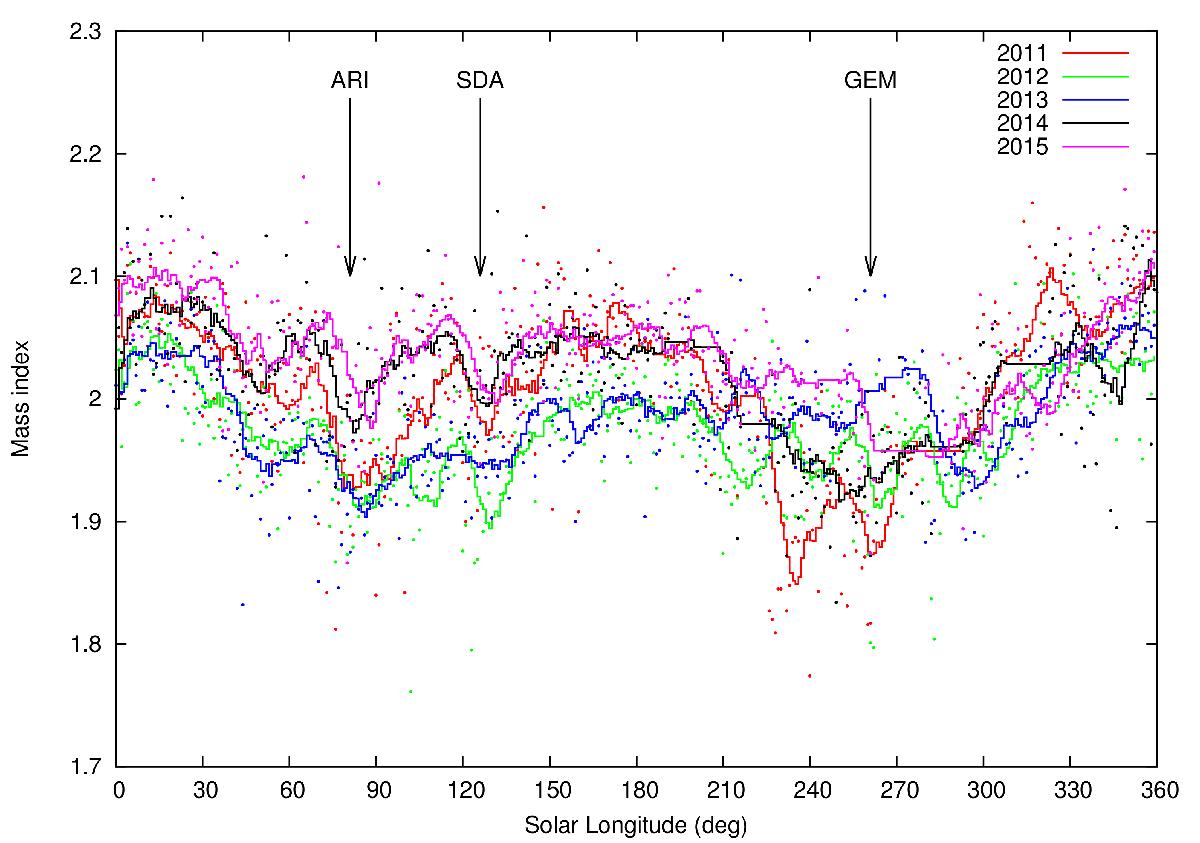
Variations of the mass index measured over five consecutive years 2011–2015 by the 29.85 MHz CMOR radar. Color-coded dots represent the mass index for each 1° solar longitude bin and color-coded lines show the moving average with 10° window averages. Arrows with labels denote maxima of Arietids (ARI), Southern Delta Aquariids (SDA), and Geminids (GEM) meteor showers.
Current usage metrics show cumulative count of Article Views (full-text article views including HTML views, PDF and ePub downloads, according to the available data) and Abstracts Views on Vision4Press platform.
Data correspond to usage on the plateform after 2015. The current usage metrics is available 48-96 hours after online publication and is updated daily on week days.
Initial download of the metrics may take a while.